Introduction
The VRSI indicator is another in the suite of volume indicators we have developed and one that complements our volume price analysis methodology perfectly. and was developed out of a desire to build further on our cornerstone of VPA by peeling back the layers of volume and considering its relative aspect. Hence, the acronym of Volume Relative Strength Index indicator encapsulates what the indicator is all about.
Volume Is Pressure
By analysing relative volume, we are able to see a visual representation of the pressure in a trend, or indeed the lack of pressure, and in doing so, present in a clear, intuitive, and colorful way whether the trend we are trading or considering joining is being driven with constant or rising pressure as it develops. If so, the indicator gives us that all-important ingredient: confidence—namely, the confidence to continue maintaining the position for as long as possible. However, equally important is when we see a trend that is tiring, with falling pressure, sending a strong signal it is time to close out. Alternatively, when there is little or no pressure in the trend, this is a signal to wait and be patient.
These signals are delivered in a variety of ways, primarily through a color change sequence of brighter or darker colors, but equally importantly, based on the height of each pressure bar and its relationship to its neighbor or groups of bars. And herein lies the close relationship to the volume price analysis methodology since the interpretation of both is about judging bars against one in terms of confirmation of trends, such as rising volume and rising pressure bars, or alternatively falling volume and falling pressure bars signaling that the trend is weakening.
What Will The Volume Relative Strength Indicator for TradingView Do For Me?
The Volume Relative Strength Index (VRSI) embodies the core concept of volume-price analysis. It blends trading volume data with price to create an indicator for all the various markets and instruments, whether stocks, ETFs, futures, forex, or cryptocurrencies. The result is an intuitive visual representation of the market’s underlying bullish and bearish pressure in the form of an oscillating histogram with varying colors, with the central fulcrum at zero giving a clear indication when sentiment is shifting from bullish to bearish, or vice versa.
Now, for the first time, you can see the strength of the trend represented visually and clearly based on our two leading indicators of relative volume and price, giving you that essential ingredient we all seek: confidence. And just as with all our other indicators, we urge you to use it in multiple timeframes.
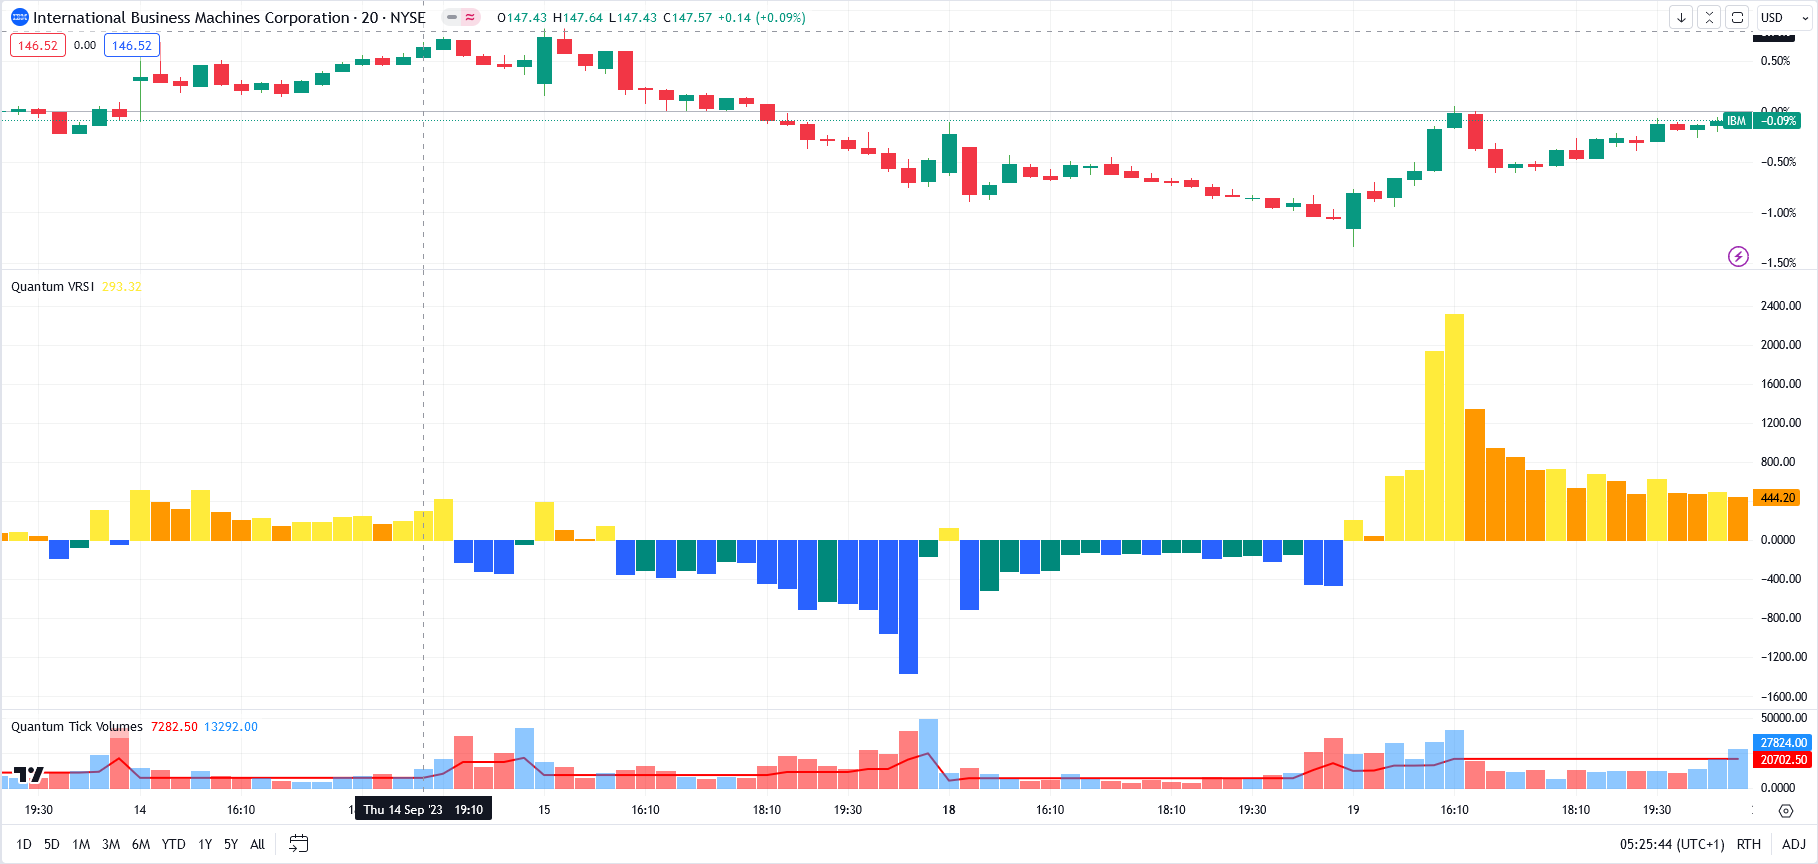
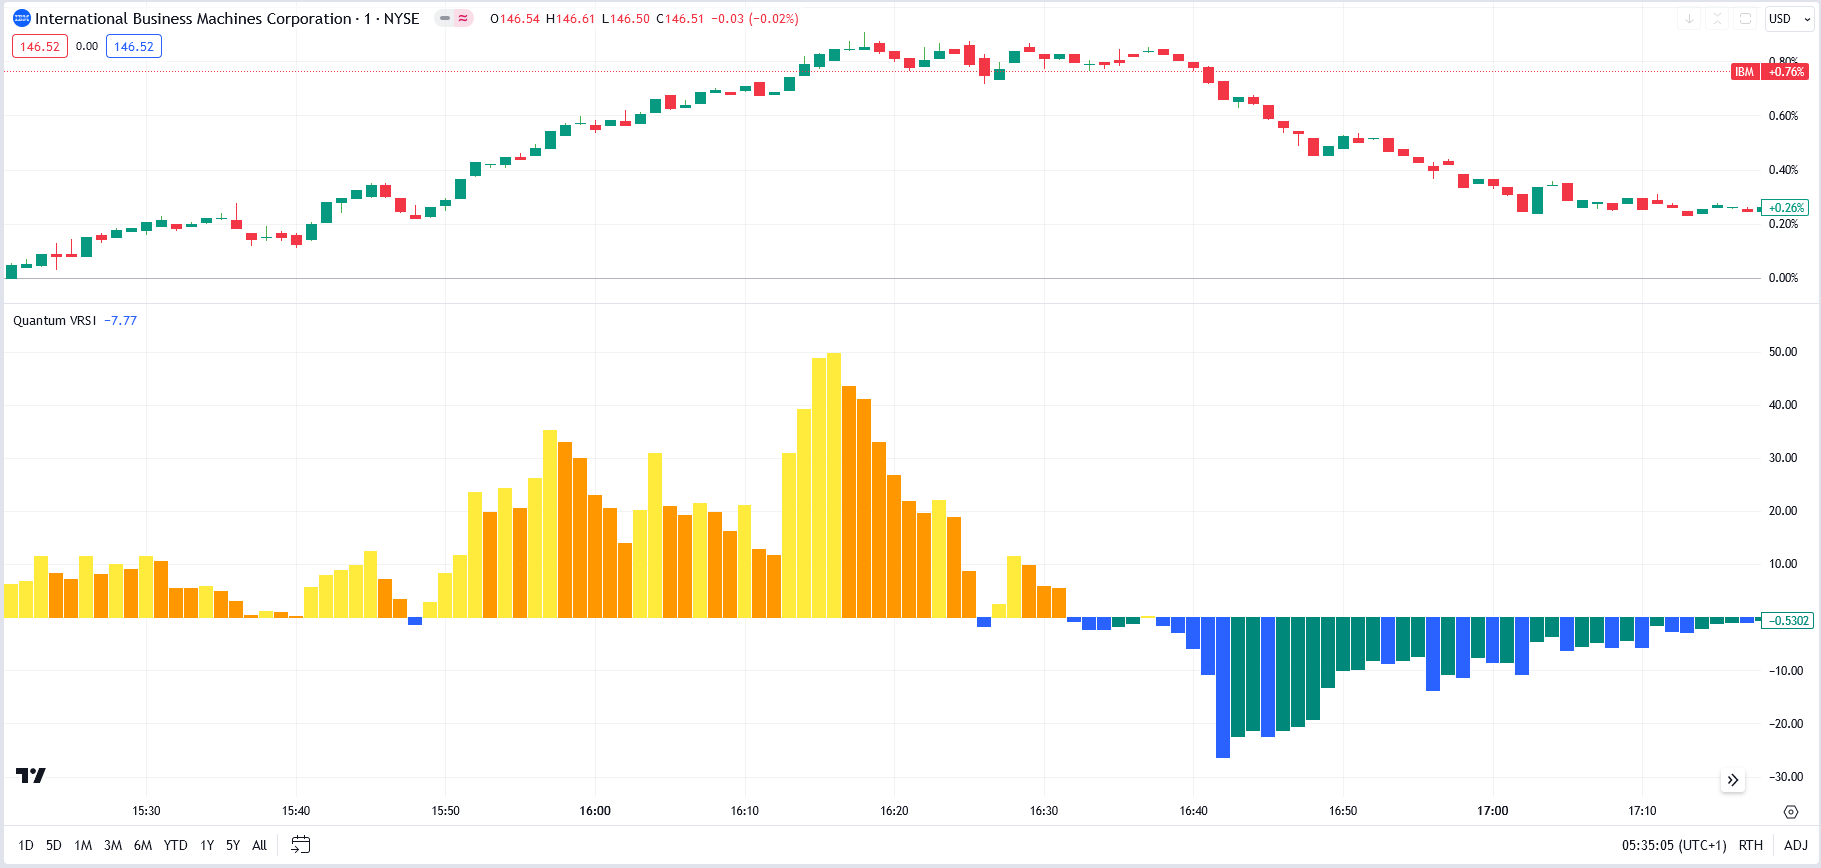
The Histogram
The histogram oscillates around the zero level at varying degrees as indicated by each bar’s length.
- A bar ABOVE zero is a bullish signal and can be categorized into 2 types:
- Strong bullish sentiment – This is characterized by a long upward bar that succeeds a shorter bar or group of bars.
- Weak/diminishing bullish sentiment – This is characterized by a short upward bar that succeeds a longer bar or group of bars.
- A bar BELOW zero is a bearish signal and can also be categorized into 2 types:
- Strong bearish sentiment – This is characterized by a long downward bar that succeeds a shorter bar or group of bars.
- Weak/diminishing bearish sentiment – This is characterized by a short downward bar that succeeds a longer bar or group of bars.
There are FOUR types of bars in total and they are easily distinguishable by their varying colors which can be customized in the indicator properties window. The current sentiment, whether it is bullish or bearish pressure, is strong when the bar moves further away from zero while it appears to diminish or weaken when the bar shortens and moves back towards zero. The length of the bar represents the amount of pressure towards the current sentiment which is largely influenced by trading volume. When the VRSI crosses zero either from negative to positive or vice versa, this signifies a potential trend reversal. Sometimes, it can also mean a pause before a continuation of an existing trend.
Settings
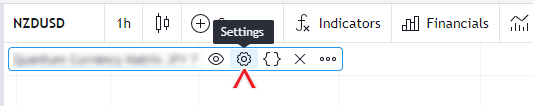
The Settings button appears as a small cog/gear icon beside the name of the indicator at the chart. Clicking the button shows a dialog box for configuring the Inputs and Style options.
Inputs
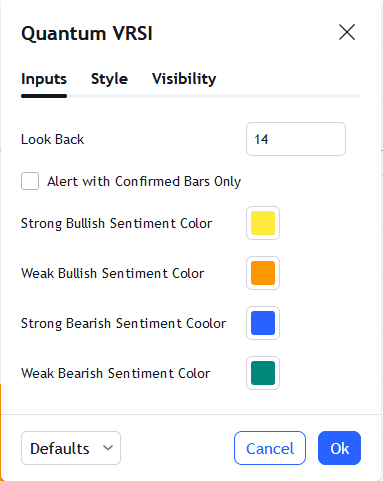
Look Back
This setting determines the look back period or the number of bars the indicator takes in to calculate the VRSI. Its default value is 14 bars.
Alert with Confirmed Bars Only
If this setting is enabled, alerts are not triggered by signals on the open/forming bar. All bars that meet the condition must be closed to trigger an alert.
Strong Bullish Sentiment Color
Sets the color of the VRSI when a strong bullish signal is detected.
Weak bullish Sentiment Color
Sets the color of the VRSI when a weak bullish signal is detected.
Strong Bearish Sentiment Color
Sets the color of the VRSI when a strong bearish signal is detected.
Weak Bearish Sentiment Color
Sets the color of the VRSI when a weak bearish signal is detected.
Style
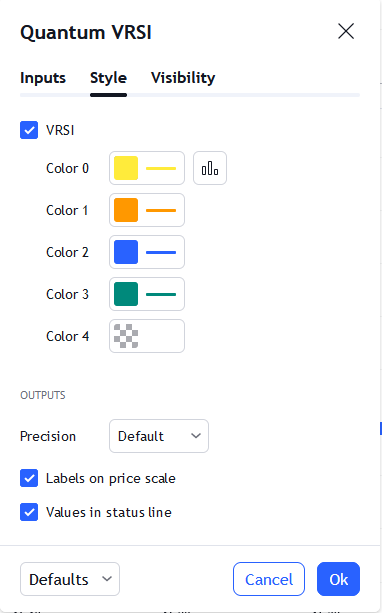
VRSI
This plot represents the VRSI in the form of a histogram.
- You can hide or display the VRSI histogram using the checkbox.
- Its color changes depending on the current sentiment. The different colors can be changed in the indicator settings in the Inputs tab.
- The second box allows you to change the plot type and enable the Price Line. The Price Line is a horizontal line that keeps track of the plot’s current value. Changing the plot type is not recommended.
Precision
This determines the number of decimal places the indicator uses to display the current value of its plots. You can adjust this by choosing from a drop-down list.
Labels on price scale
This option shows/hides the current value of the plots in the price axis.
Values in status line
This option shows/hides the current value of the plots beside the indicator label/name while it is active on the chart.
Alerts
Change in Sentiment
Alert Conditions
- Weak Bullish
- Strong Bullish
- Strong Bearish
- Weak Bearish
Condition
Triggers when a change in sentiment is detected or visually, when the VRSI changes its color.
Alert message
The following alert messages are used respectively with the corresponding Alert Conditions above
Examples:
- WEAK BULLISH sentiment detected.
- STRONG BULLISH sentiment detected.
- STRONG BEARISH sentiment detected.
- WEAK BEARISH sentiment detected.
Zero Cross
Alert Conditions
- Cross Over
- Cross Under
Condition
Triggers when VRSI crosses over or crosses under the fulcrum at the zero level.
Alert message
The following alert messages are used respectively with the corresponding Alert Conditions above
Examples:
- VRSI crosses over 0
- VRSI crosses under 0