Introduction
The Market Strength Indicator (MSI) is yet another in our stable of volume-based indicators, and as such, is a must-have tool for trading virtually any type of market and across a myriad of applications from trend trading to swing trading, scalping, and much more. While its sister indicator, the Currency Strength Indicator (CSI), helps you analyze which currencies are oversold, overbought, correlating, and trending, the MSI or Market Strength Indicator does this also, but in this case, for all markets, including stocks, ETFs, futures, and cryptocurrencies, but with one key difference – VOLUME.
As with our core methodology of volume price analysis, volume adds an entirely new dimension to trading analysis as it reveals the driving pressure behind the price action, be it strong or weak, which are all factored into the algorithm that drives the Market Strength Indicator. But with the MSI indicator, its use and application is only limited by your imagination.
For example, we can use it to see which markets are correlating and which are not so that we might use it as an intraday tool for index futures. And, of course, with knowledge gained from the stock trading and investing program, we could then further validate any analysis by setting each against the top five market cap stocks, for confirmation of strength and to give us more confidence in trading an index future.
And not just index futures, but any futures you care to consider, such as energy, metals, softs, currencies or anything else.
For Day Trading Stocks
For day traders of stocks, you might wish to see which are correlating with one another and which are not, for example, if you are pairs trading, and also whether a particular stock is moving with the primary futures index. If not, this may be a warning sign. And of course, for ETF traders, we have the SPY, a host of ETFs, and alongside them, the sectors, such as the XLK, the XLE, and more, giving you an instant and powerful insight into sentiment across the entire market complex.
The Market Strength Indicator has much to offer; whether you are a stock investor or day trading scalper, index or ETF trader, swing trader or trend trader, it is all here as the indicator signals in a clear and intuitive way when a stock, future or ETF is overbought or oversold in all timeframes, giving you that potent insight into potential reversals from strong to weak and back again. If you enjoy getting into a trend early and trading reversals, then this is the indicator for you, but if you prefer trading trends – no problem, just jump aboard once the move has some momentum and is underway as displayed by the steepness of the line on the indicator.
It’s all here and so much more, from market correlations to market strength and weakness and in all the timeframes from seconds to months.
Overbought and Oversold
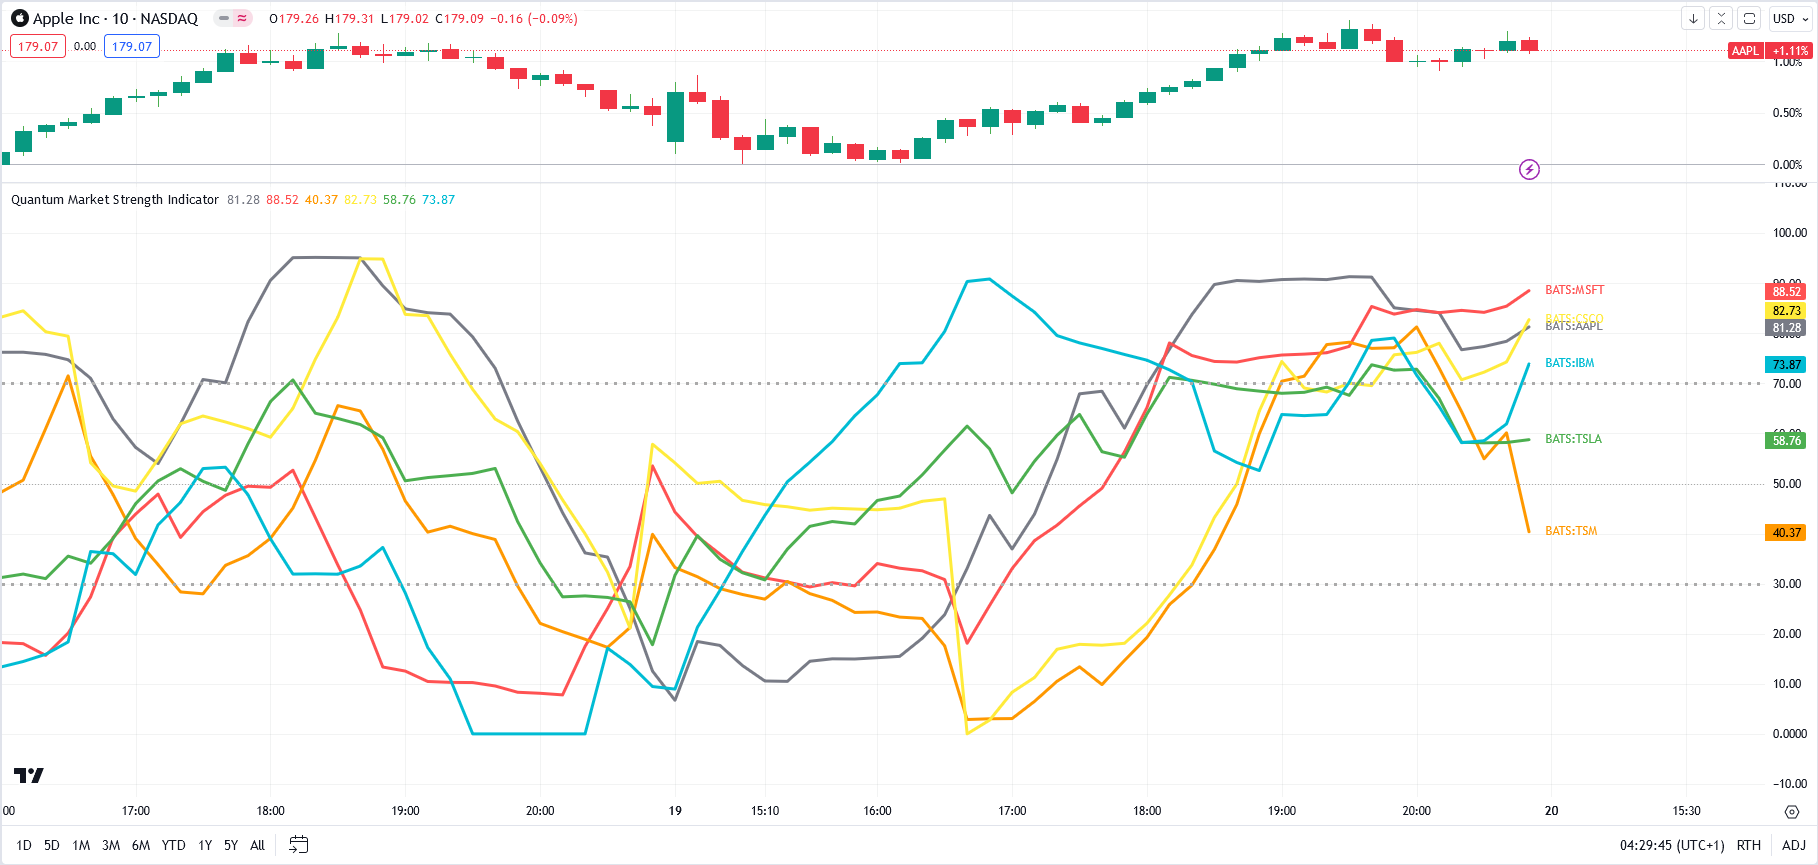
And just like its sister indicator, the CSI, the MSI is an oscillator that moves seamlessly from overbought to oversold and back again between a value of 100 at the top and zero at the bottom, with each instrument or market represented with a single-colored line. To help further, we’ve included two regions on the indicator to represent these states at 70 and 30, respectively, but you can change these accordingly and perhaps extend them further to 80 and 20. These levels are purely intended as guides to help provide additional information as to the market state and a potential reversal in due course.
Now, in a single indicator, you have the opportunity to gauge sentiment across multiple markets, whether these are correlating or not, and from there develop a myriad of trading opportunities, or alternatively give you that all-important confidence to dive in, or maintain an existing position. Through its unique algorithm based on volume, it is another indicator only limited by your imagination, and like all our other indicators, one we urge you to use in multiple timeframes.
Getting started
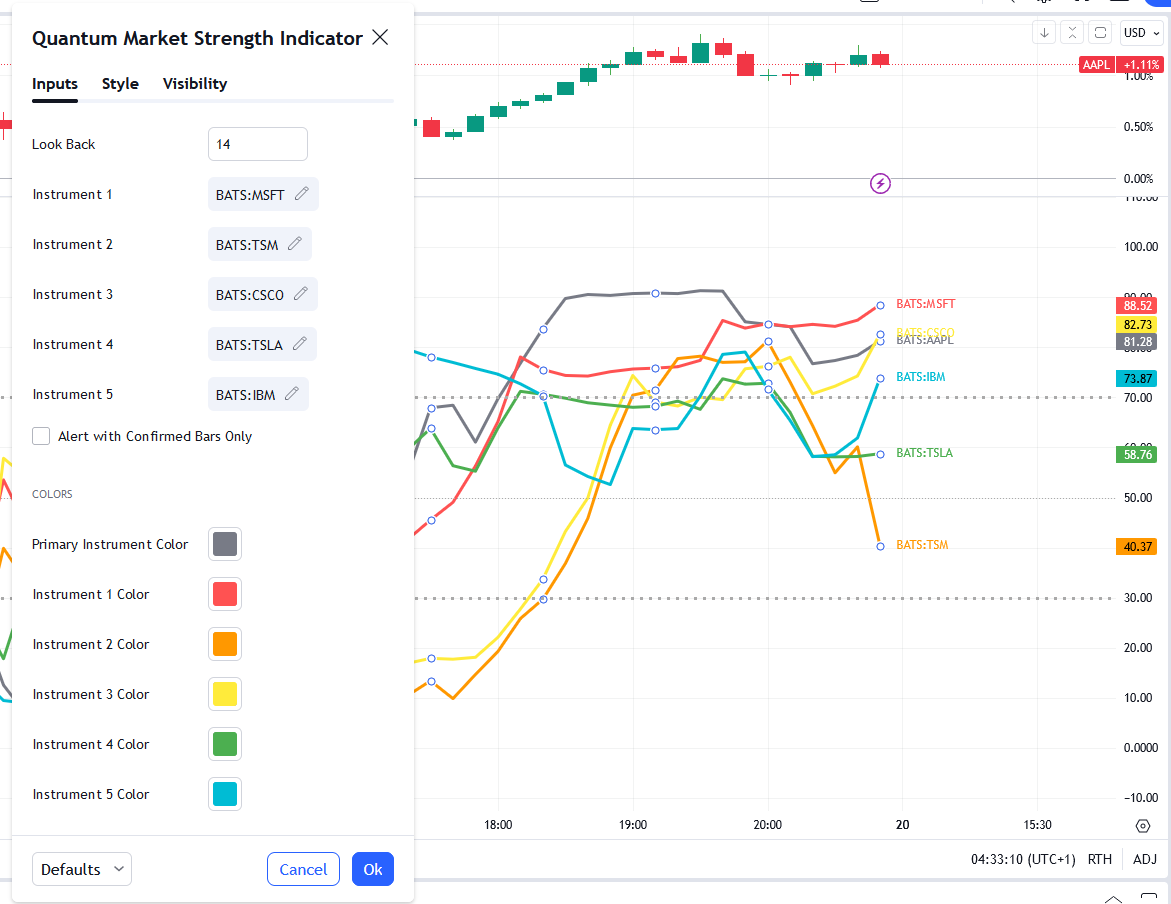
The MSI can calculate and display the strength of up to 6 different instruments at once in the same window but at the minimum, it will always display the chart’s current instrument which we will call the Primary Instrument. Additional instruments can be added in the MSI in the indicator properties window using the instrument selector where you can quick search any symbol. There are 5 slots for additional instruments labeled Instrument 1, Instrument 2, and up to Instrument 5. If the instrument slot is enabled and the selected symbol exists in your data feed, then it will create a new line within the MSI alongside the Primary Instrument.
Instrument types and timelines
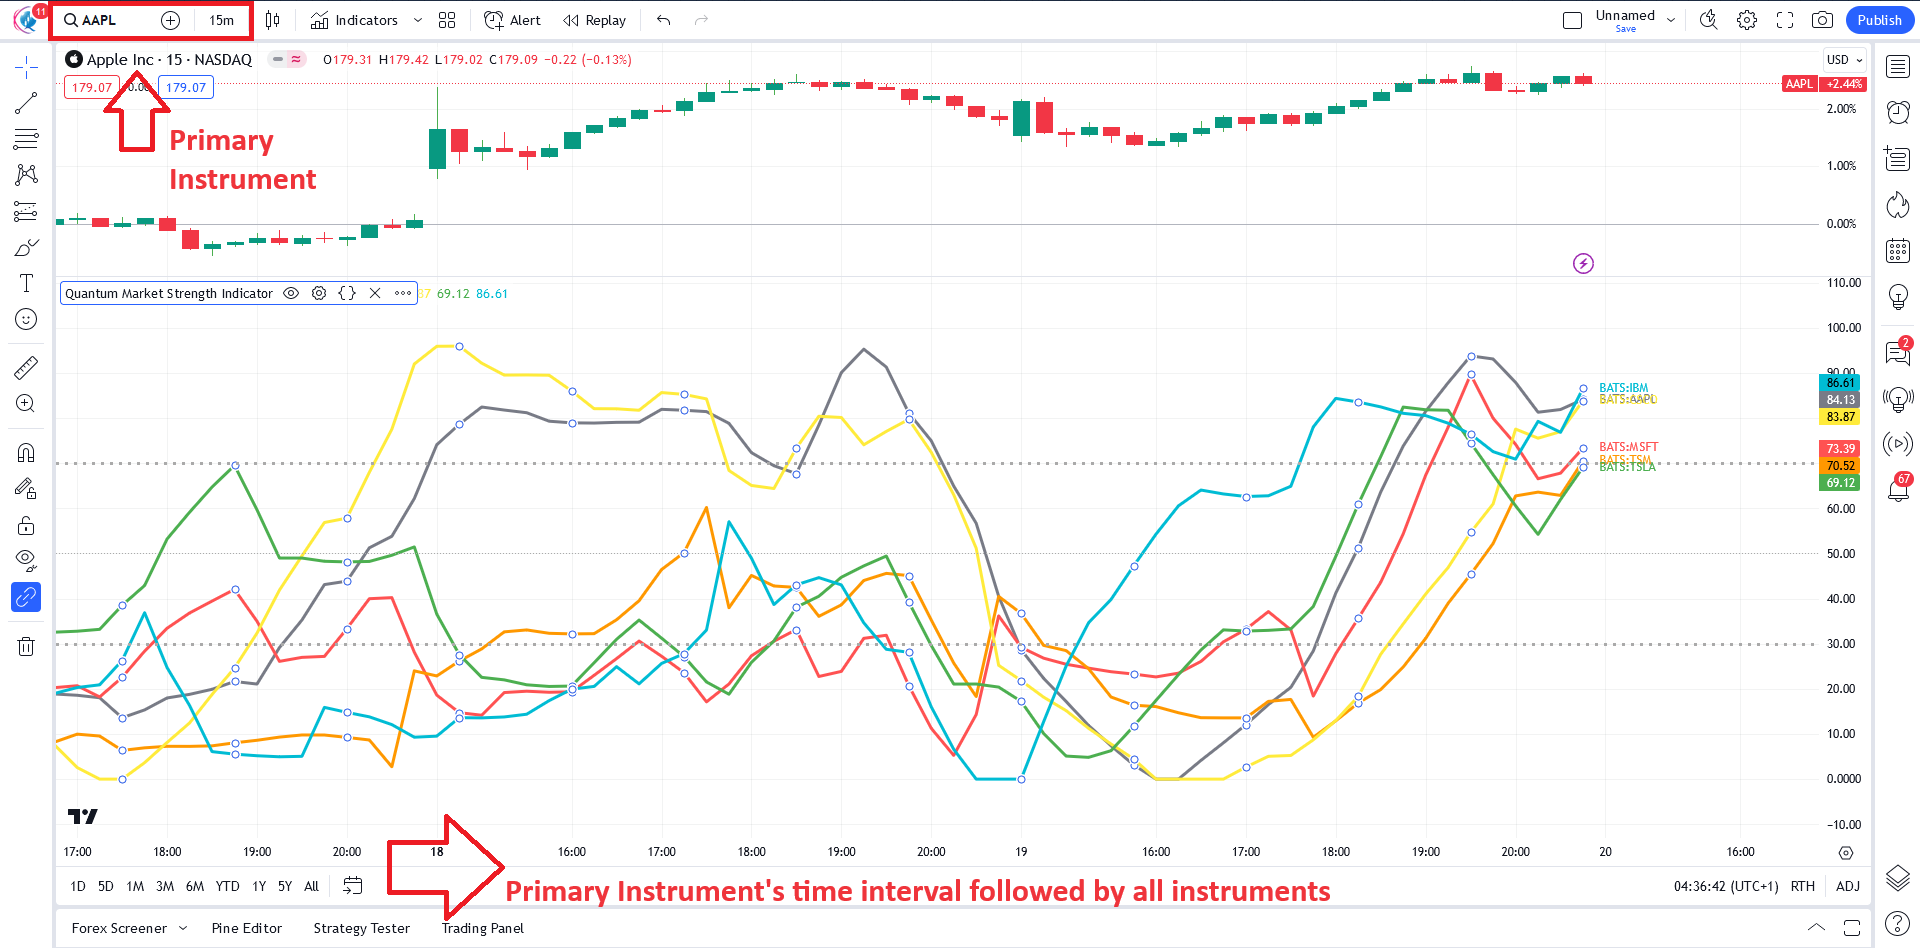
Please keep in mind that every instrument type has its own session periods that dictate how the intervals in the timeline (the y-axis of the chart) are laid out. This becomes more apparent when adding different types of instruments in the MSI which always use the Primary Instrument’s time axis.
All 5 of the additional instruments adapt to the chart’s time-axis which can produce interesting results in different scenarios.
The First Scenario
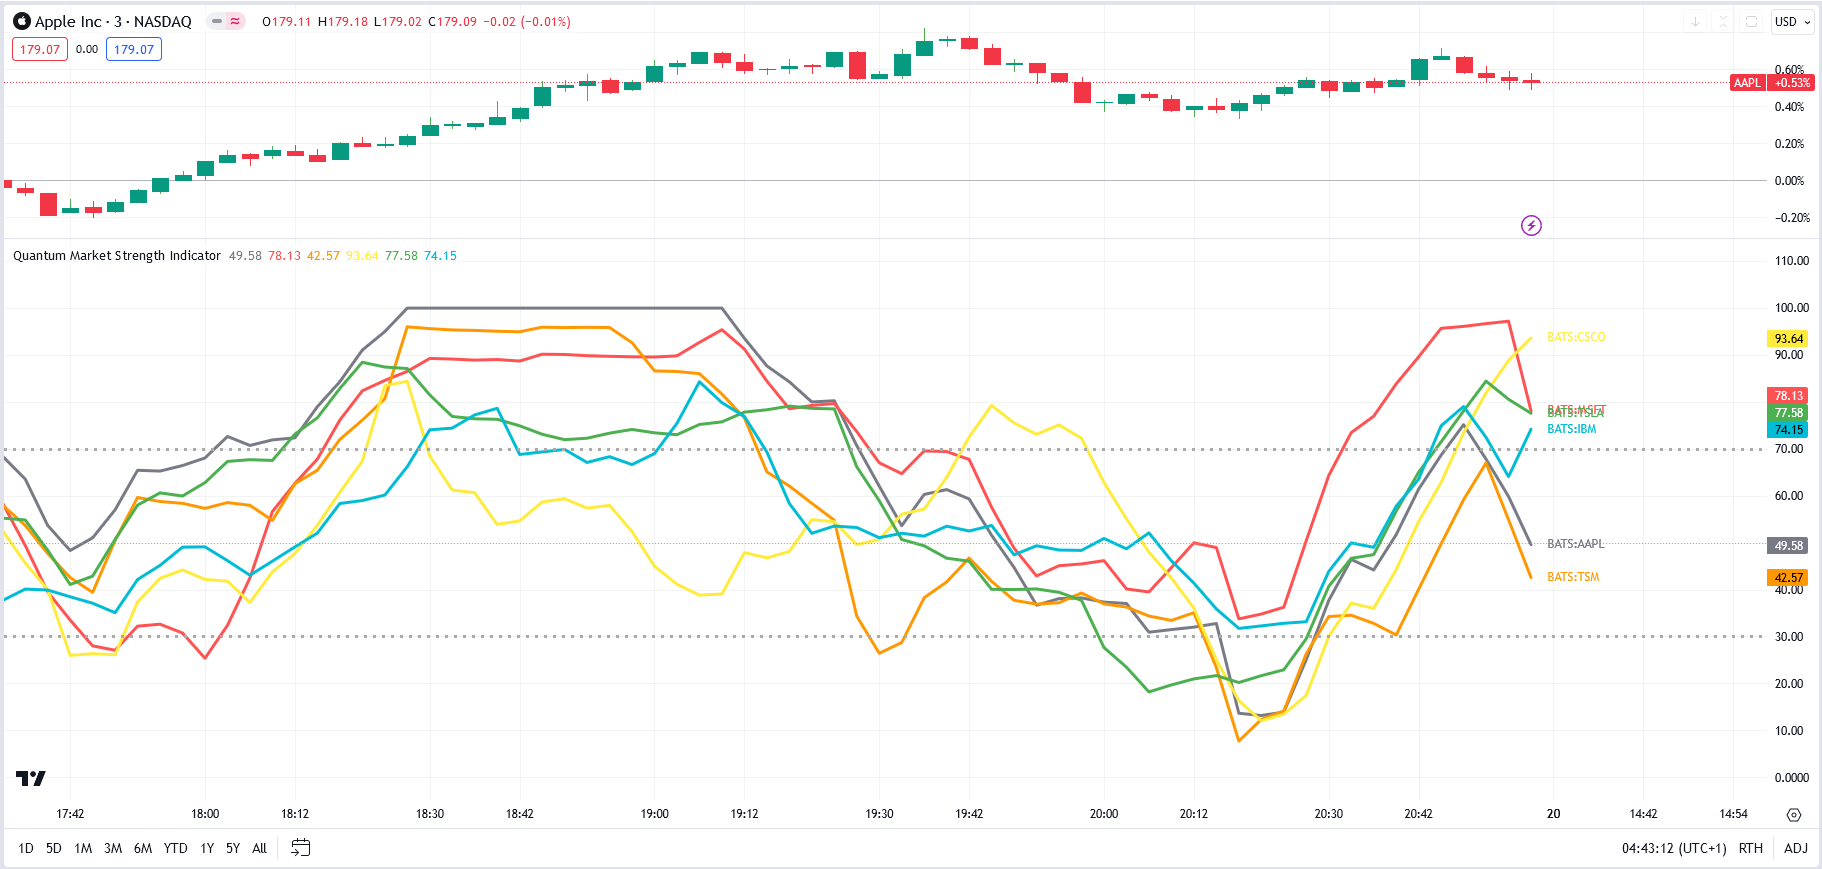
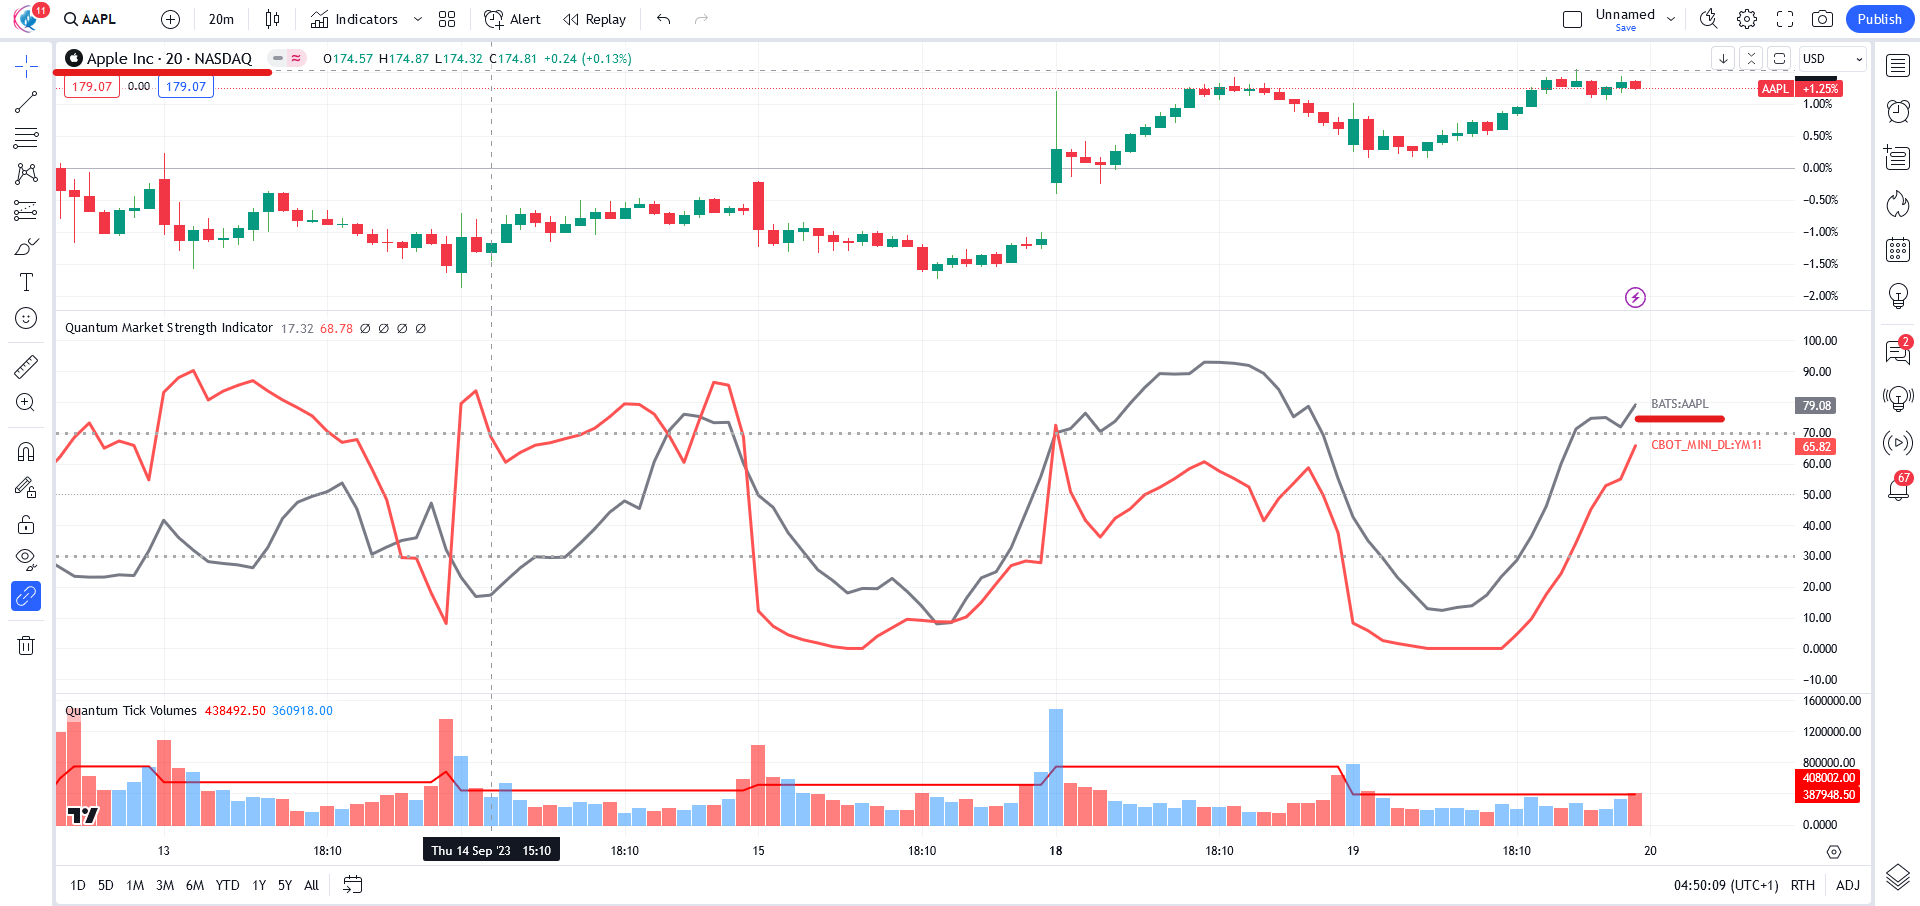
The first scenario is when the added instruments are the same type as the Primary Instrument. For example, the Primary Instrument is a stock and all instruments added are also stocks. The resulting chart is what you would say is typical as all the data points of all instruments are displayed fully as their sessions align perfectly with each other.
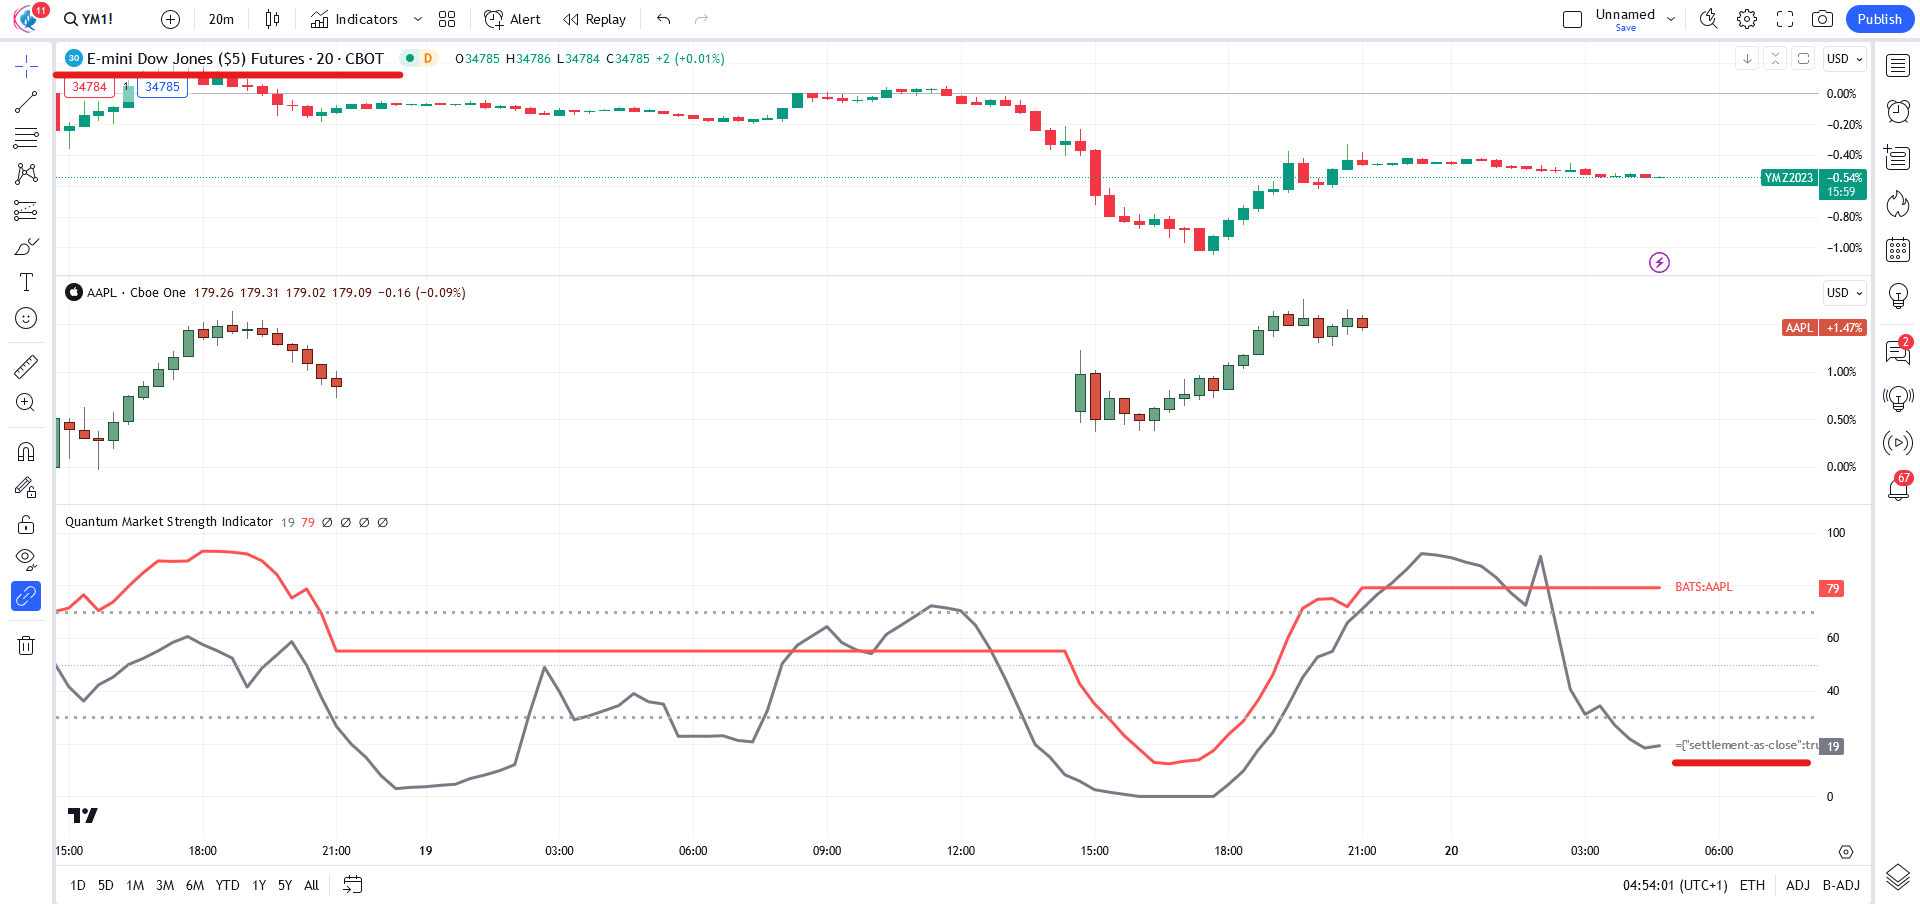
The second scenario is when the added instruments are of different type with different session times. Consider this example: the Primary Instrument is the AAPL stock, but a YM future instrument is added. Because stocks have limited session times compared to futures, YM’s line is incomplete with some of its parts hidden. In this case, the MSI is not able to display YM’s entire output. In a different example, YM future is the Primary instrument and the AAPL stock is added.
Futures are active in more time periods than stocks which means their time-axis show more date/time than a stock chart. In this case, no data point is omitted as a result but AAPL’s line will have gaps where the stock was out of session and the future was active.
Having mentioned these scenarios, it is important to consider the type of your Primary Instrument and of the instruments that you plan to add in the instance.
Settings
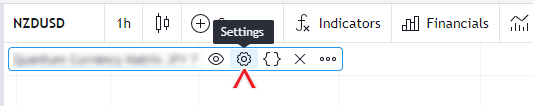
The Settings button appears as a small cog/gear icon beside the name of the indicator at the chart. Clicking the button shows a dialog box for configuring the Inputs and Style options.
Inputs
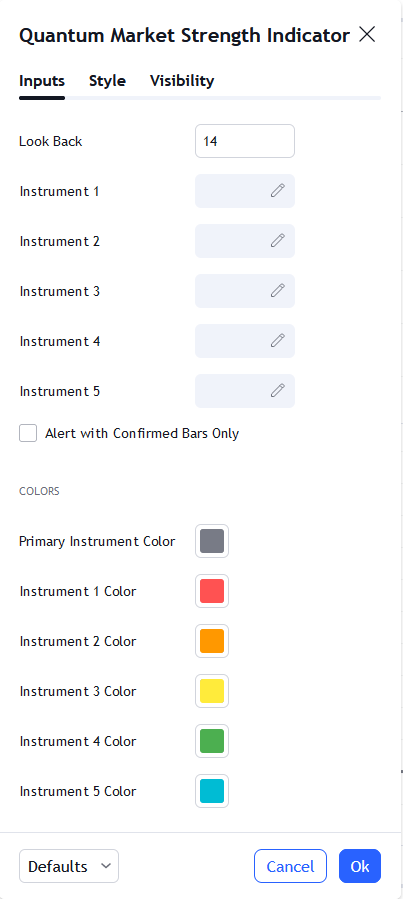
Look Back
Sets the look back period or the number of bars the indicator takes from its roster of instruments to calculate their strength. Its default is 14 bars.
Instrument 1
Identifies the symbol and activates the slot of the first instrument to calculate its strength alongside the main chart’s instrument. It is recommended to select an instrument from the same market as the main chart to ensure all data points are synchronized.
Instrument 2
Identifies the symbol and activates the slot of the second instrument to calculate its strength alongside the main chart’s instrument. It is recommended to select an instrument from the same market as the main chart to ensure all data points are synchronized.
Instrument 3
Identifies the symbol and activates the slot of the third instrument to calculate its strength alongside the main chart’s instrument. It is recommended to select an instrument from the same market as the main chart to ensure all data points are synchronized.
Instrument 4
Identifies the symbol and activates the slot of the fourth instrument to calculate its strength alongside the main chart’s instrument. It is recommended to select an instrument from the same market as the main chart to ensure all data points are synchronized.
Instrument 5
Identifies the symbol and activates the slot of the fifth instrument to calculate its strength alongside the main chart’s instrument. It is recommended to select an instrument from the same market as the main chart to ensure all data points are synchronized.
Alert with Confirmed Bars Only
If this setting is enabled, alerts are not triggered by signals on the open/forming bar. All bars that meet the condition must be closed to trigger an alert.
Primary Instrument Color
Sets the plot color and label color of the Primary Instrument
Instrument 1 Color
Sets the plot color and label color of Instrument 1
Instrument 2 Color
Sets the plot color and label color of Instrument 2
Instrument 3 Color
Sets the plot color and label color of Instrument 3
Instrument 4 Color
Sets the plot color and label color of Instrument 4
Instrument 5 Color
Sets the plot color and label color of Instrument 5
Style
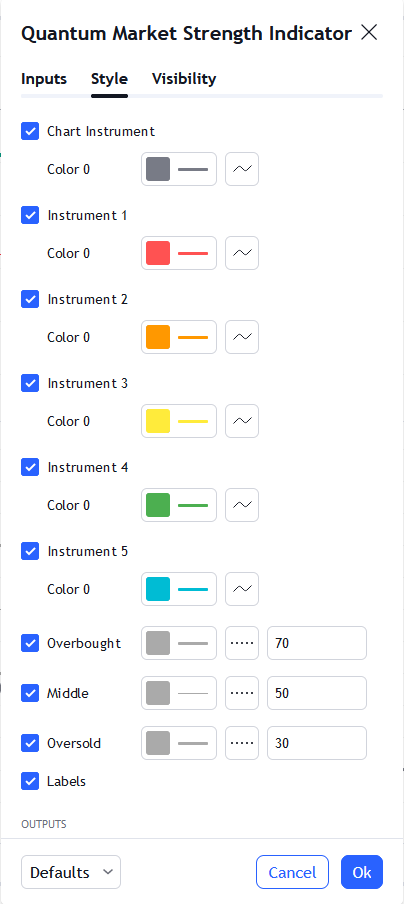
Chart Instrument
This plot represents the Primary Instrument.
- You can hide or display the Primary Instrument line using the checkbox.
- Its color is set by the Primary Instrument Color setting in the Inputs tab, and the default thickness is set to 3.
- The second box allows you to change the plot type and enable the Price Line. The Price Line is a horizontal line that keeps track of the plot’s current value. Changing the plot type is not recommended.
Instrument 1
This plot represents Instrument 1
- You can hide or display the Instrument 1’s line using the checkbox.
- Its color is set by the Instrument 1 Color setting in the Inputs tab, and the default thickness is set to 3.
- The second box allows you to change the plot type and enable the Price Line. The Price Line is a horizontal line that keeps track of the plot’s current value. Changing the plot type is not recommended.
Instrument 2
This plot represents Instrument 2
- You can hide or display the Instrument 2’s line using the checkbox.
- Its color is set by the Instrument 2 Color setting in the Inputs tab, and the default thickness is set to 3.
- The second box allows you to change the plot type and enable the Price Line. The Price Line is a horizontal line that keeps track of the plot’s current value. Changing the plot type is not recommended.
Instrument 3
This plot represents Instrument 3
- You can hide or display the Instrument 3’s line using the checkbox.
- Its color is set by the Instrument 3 Color setting in the Inputs tab, and the default thickness is set to 3.
- The second box allows you to change the plot type and enable the Price Line. The Price Line is a horizontal line that keeps track of the plot’s current value. Changing the plot type is not recommended.
Instrument 4
This plot represents Instrument 4
- You can hide or display the Instrument 4’s line using the checkbox.
- Its color is set by the Instrument 4 Color setting in the Inputs tab, and the default thickness is set to 3.
- The second box allows you to change the plot type and enable the Price Line. The Price Line is a horizontal line that keeps track of the plot’s current value. Changing the plot type is not recommended.
Instrument 5
This plot represents Instrument 5
- You can hide or display the Instrument 5’s line using the checkbox.
- Its color is set by the Instrument 5 Color setting in the Inputs tab, and the default thickness is set to 3.
- The second box allows you to change the plot type and enable the Price Line. The Price Line is a horizontal line that keeps track of the plot’s current value. Changing the plot type is not recommended.
Overbought
This is a horizontal line which serves as a guide in indicating a currency has reached a state of overbought when its line crosses above this threshold. Remember this is a guide ONLY!
- You can hide or display the Overbought line using the checkbox.
- You can customize the color, opacity, and thickness of this plot by clicking the color box. The default color is gray, and the thickness is set to 3.
- The second box allows you to choose a different line style.
- The text box defines the price level of the horizontal line. Please keep its value at 70.
Middle
This is a horizontal line which serves as a guide in indicating the middle level of the oscillator. Remember this is a guide ONLY!
- You can hide or display the Middle line using the checkbox.
- You can customize the color, opacity, and thickness of this plot by clicking the color box. The default color is gray, and the thickness is set to 1.
- The second box allows you to choose a different line style.
- The text box defines the price level of the horizontal line. Please keep its value at 50.
Oversold
This is a horizontal line which serves as a guide in indicating a currency has reached a state of oversold when its line crosses below this threshold. Remember this is a guide ONLY!
- You can hide or display the Oversold line using the checkbox.
- You can customize the color, opacity, and thickness of this plot by clicking the color box. The default color is gray, and the thickness is set to 3.
- The second box allows you to choose a different line style.
- The text box defines the price level of the horizontal line. Please keep its value at 30.
Labels
This option shows/hides the label objects used by the indicator. Please keep this option enabled.
Precision
This determines the number of decimal places the indicator uses to display the current value of its plots. You can adjust this by choosing from a drop-down list.
Labels on price scale
This option shows/hides the current value of the plots in the price axis.
Values in status line
This option shows/hides the current value of the plots beside the indicator label/name while it is active on the chart.
Alerts
The Market Strength Indicator has a total of 12 alert conditions which act as guides.
Overbought
Alert Conditions
- Overbought: Primary Instrument
- Overbought: 1st Instrument
- Overbought: 2nd Instrument
- Overbought: 3rd Instrument
- Overbought: 4th Instrument
- Overbought: 5th Instrument
Condition
Triggers when the Instrument is greater than or equal to 70 (Overbought).
Alert message
The following alert messages are used respectively with the corresponding Alert Conditions above
Examples:
- Primary instrument is OVERBOUGHT.
- 1st instrument is OVERBOUGHT.
- 2nd instrument is OVERBOUGHT.
- 3rd instrument is OVERBOUGHT.
- 4th instrument is OVERBOUGHT.
- 5th instrument is OVERBOUGHT.
Oversold
Alert Conditions
- Oversold: Primary Instrument
- Oversold: 1st Instrument
- Oversold: 2nd Instrument
- Oversold: 3rd Instrument
- Oversold: 4th Instrument
- Oversold: 5th Instrument
Condition
Triggers when the instrument is less than or equal to 30 (Oversold)
Alert message
The following alert messages are used respectively with the corresponding Alert Conditions above
- Primary instrument is OVERSOLD.
- 1st instrument is OVERSOLD.
- 2nd instrument is OVERSOLD.
- 3rd instrument is OVERSOLD.
- 4th instrument is OVERSOLD.
- 5th instrument is OVERSOLD.