Overview

Exciting new markets require exciting new indicators and with the plethora of cryptocurrencies now available and increasingly being offered through mainstream brokers, at Quantum Trading we thought it was time for us to step in and develop something unique to help traders and investors trading the new kids on the block.
Cryptocurrencies like their more established cousins in forex, are in a constant state of flux moving from overbought to oversold and back again, but at a much faster pace, and generally associated with volatility.
The Challenge
The challenge of course is picking those phases of price action where these conditions have been met and so offering the trader two opportunities. Either to take a position ahead of any reversal and so get in early before the trend develops, or alternatively to wait until the trend is underway and then jump in. You can think of this as a train in the station. Do you board early before it leaves, or jump aboard once it is underway? Both approaches have advantages and disadvantages, but the choice is yours.
So, our development team set to work to deliver the perfect indicator to deliver this information for you visually and quickly, and we are proud to announce the Cryptocurrency Strength Indicator or the CCSI for short. And if you thought this looks similar to its hugely popular currency strength indicator for forex then you would be right.
This indicator is of course a little different, though the principles of how to use it can be considered the same. So how does it work? Well, first of all, here we are dealing with a cryptocurrency pair, rather than isolating out the currency itself, as every cryptocurrency is quoted against the USD in some way. In these markets we are seeing the movement of the cryptocurrency against the US dollar and in developing the indicator we have chosen to display this against Tether. In other words, USDT.
The indicator displays seven of the most popular cryptocurrencies against USDT, and we have also included the option to deselect these and select others of your choice, so you have complete control over the cryptocurrencies you wish to trade. In addition, we understand that alerts are a hugely popular function of the TradingView platform, so we have added these in these also. And of course, as you would expect we have included the option to isolate out those of interest. So how do we use the indicator?
How Do Cryptocurrencies Move?
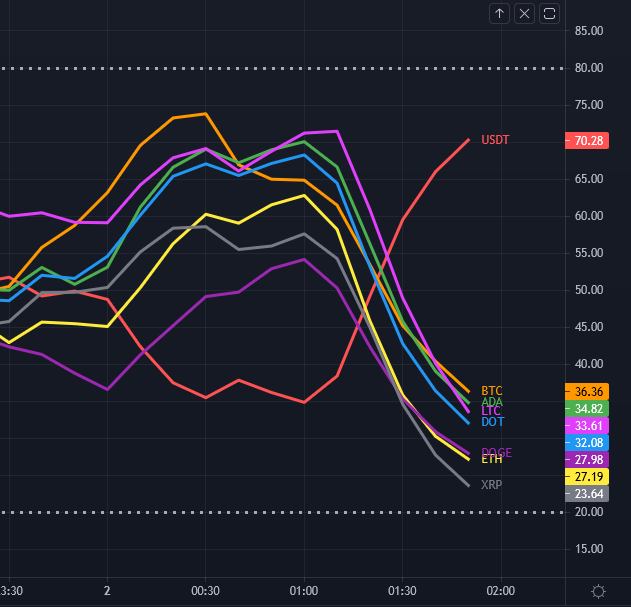
First, as you might expect, the cryptocurrency market tends to move ‘en mass’ – in other words generally either moving higher or lower together. You can think of this as an equivalent to the currency matrix in forex, where currencies of one denomination, such as the yen will all move in the same direction if the yen is being bought or sold universally. It is the same here. On occasion, on the faster timeframes, one does see divergence, but as a general rule, they will all tend to move together which is great as it gives you the confidence you are trading in the direction of the entire market.
What is important, however, is the direction of the USDT.
This will ALWAYS be in the opposite direction, which is why we isolate it from the others, to reveal precisely how this is moving. Remember, what drives a strong trend is when one currency is rising and another falling in forex and it is exactly the same here. When the USDT is rising strongly and the cryptocurrencies are falling, then a strong trend is underway. Equally, if the USDT is falling strongly then you will see a strong trend in your chosen cryptocurrency.
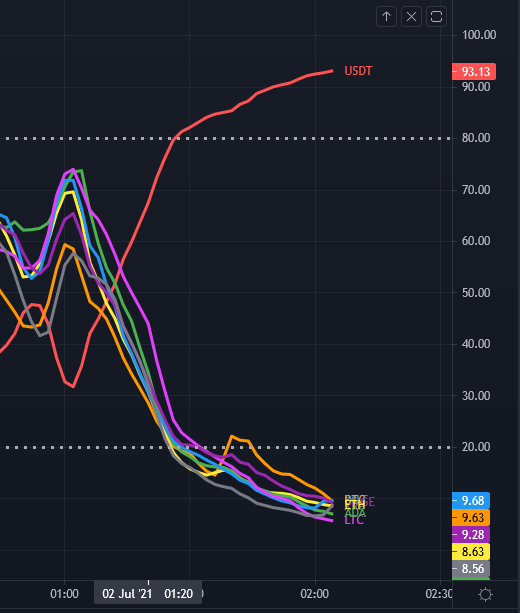
Next, we look for overbought and oversold opportunities in precisely the same way as for the currency strength indicator. Cryptocurrencies are in a constant state of flux, moving from oversold to overbought and back again in all timeframes, so there are always plenty of opportunities to employ this tactic and get in early at the start of a new trend. The angle of inclination of the line reveals the strength of the move, but equally, if the cryptocurrencies are moving sideways alongside USDT, we have to wait and be patient.
But the beauty of this market is that it genuinely trades 24 hours a day, 7 days a week. Trend trading is another great tactic, and as soon as the move is underway, you can jump on the moving train and join a current trend, and with cryptocurrencies, you don’t normally have to wait long, as the price action is constant.
However, don’t just think of the Cryptocurrency Strength Indicator as a tool for simply getting you in. It will also help you to stay in and get out at the right time. After all, if it’s good enough to get you in, then it’s good enough to keep you in also. But remember, when the lines are moving sideways along with USDT, it’s a question of patience. In other words, it helps to keep you out too.
The indicator works on all timeframes on the TradingView platform, from seconds upwards, so all trading approaches and tactics are catered for. It can be used with any instrument, whether through a conventional broker or for trading binary options, which are extremely popular, and of course, cryptocurrency futures too.
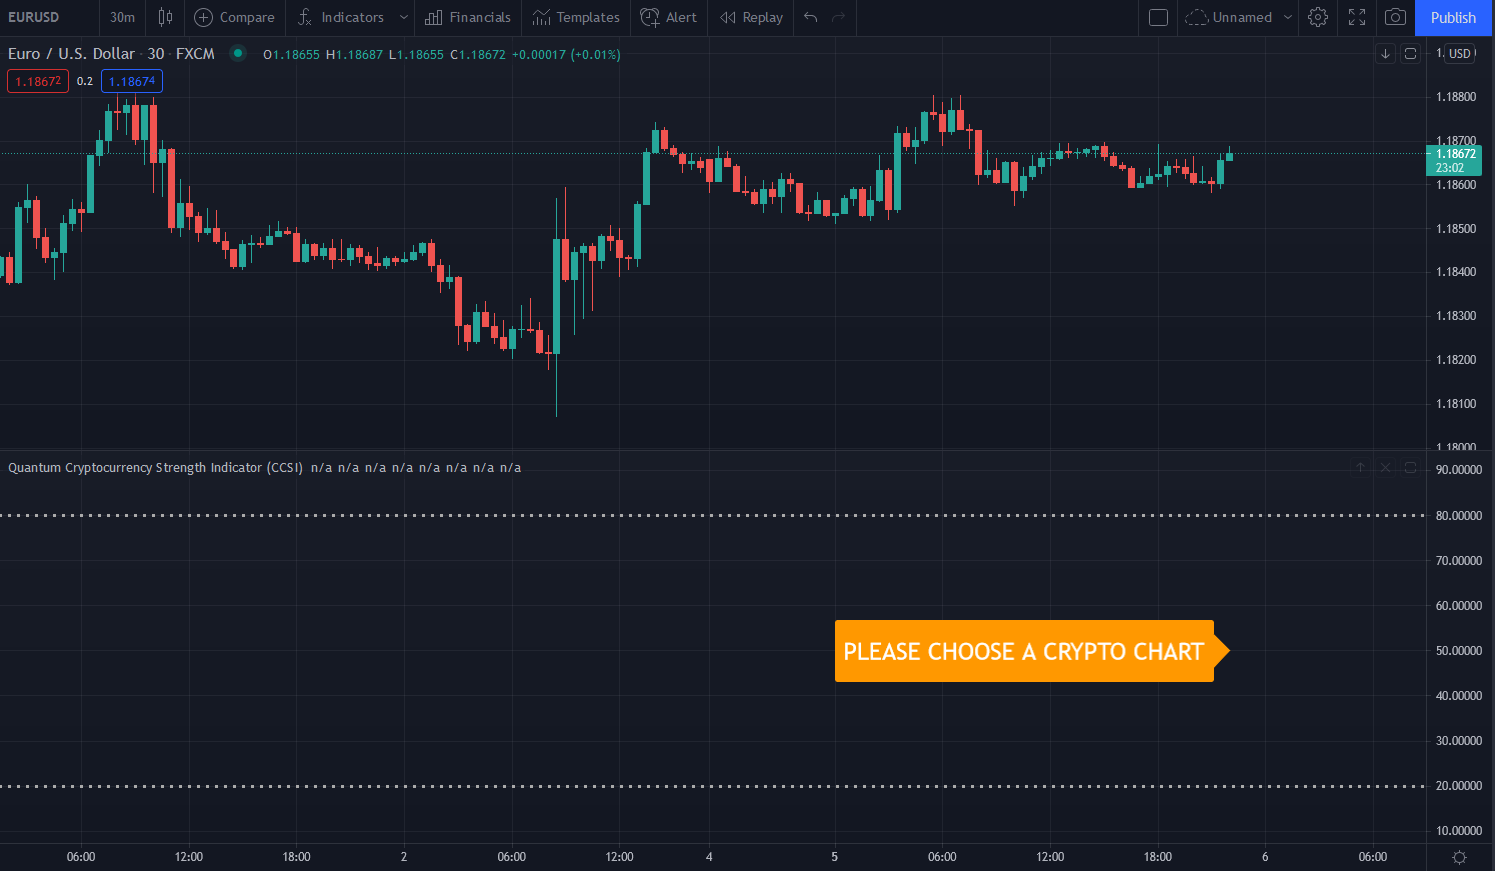
Chart
Please make sure to run the Quantum Cryptocurrency Strength Indicator in “crypto” chart types only otherwise, the indicator will display an error message.
Settings
The Settings button appears as a small cog/gear icon beside the name of the indicator at the chart. Clicking the button shows a dialog box for configuring the Inputs and Style options.
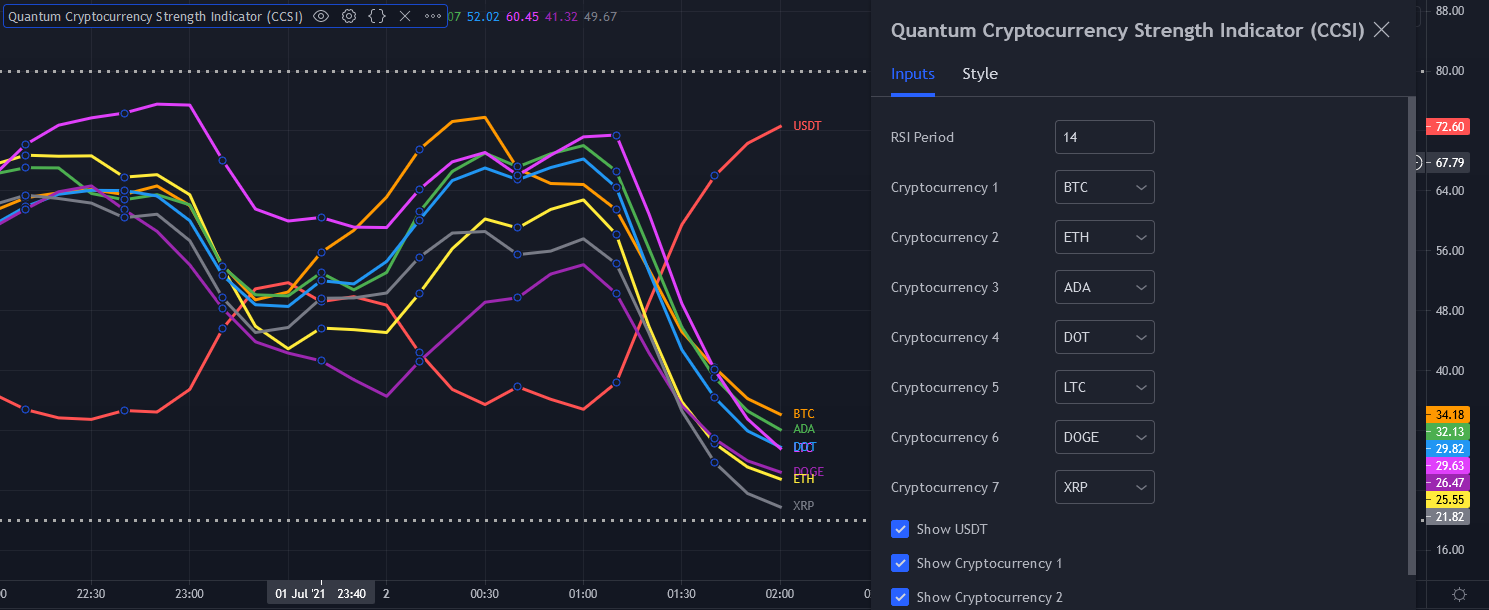
Inputs
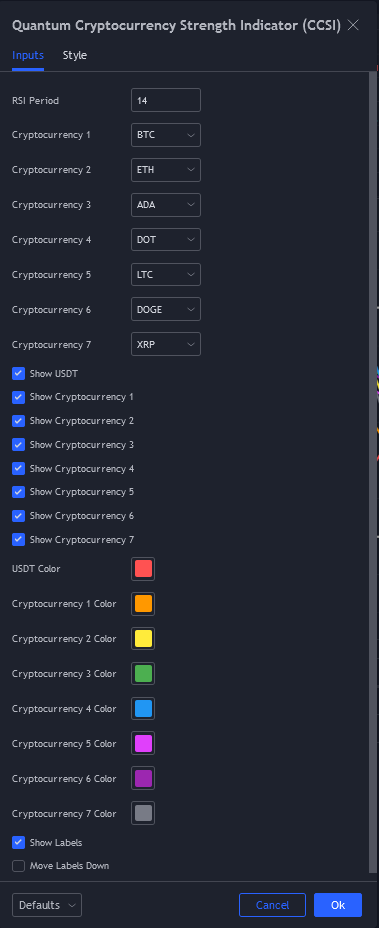
RSI Period
This input defines the length of the RSI function of the CCSI. It is set to 14 bars by default. It is recommended to use a higher length input (towards 14 or above) for longer term trading approaches while scalping trading approaches can use lower period (towards 7 or below).
Cryptocurrency 1, Cryptocurrency 2, … Cryptocurrency 7
The Quantum CCSI gives you the option to change its default 7 cryptocurrencies to calculate their strength against USDT. The following cryptocurrency symbols are available in each user input to change each of the 7 slots of the indicator: “BTC”, “ETH”, “ADA”, “DOT”, “LTC”, “DOGE”, “XRP”, “DASH”, “XMR”, “BCH”, “QTUM”, “EOS”, and “NEO”.
Show USDT, Show Cryptocurrency 1, Show Cryptocurrency 2, … Show Cryptocurrency 7
You can use these user inputs to hide or display each of the 8 cryptocurrencies in the chart.
USDT Color, Cryptocurrency 1 Color, Cryptocurrency 2 Color, … Cryptocurrency 7 Color
You can use these user inputs to change the color of each of the 8 cryptocurrencies in the chart including their labels.
Move Labels Down
Checking this input moves the labels of all the currencies at the bottom part of the indicator. This is disabled by default which puts the labels at the tip of each currency line plot they represent.
Style
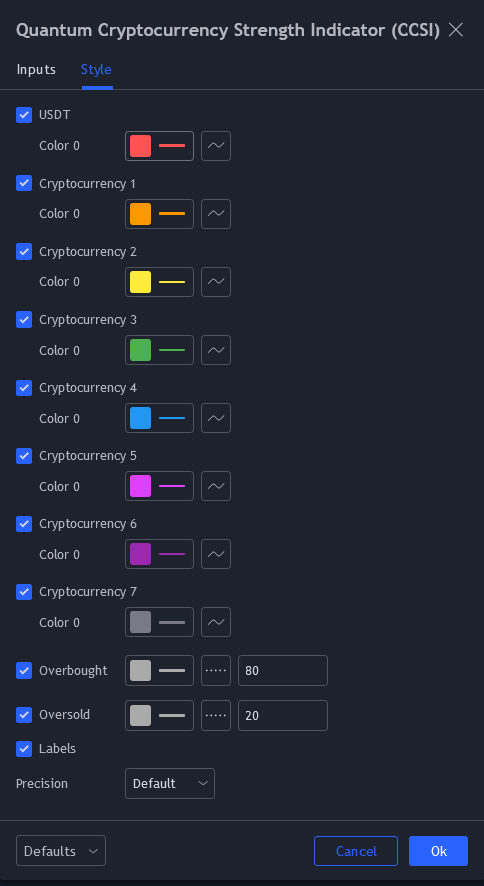
TradingView allows you to customize the indicator’s appearance by changing the properties of its plots.
USDT, Cryptocurrency 1, Cryptocurrency 2, Cryptocurrency 3, … Cryptocurrency 7
These lines represent the 8 cryptocurrencies in the Quantum CCSI.
- You can hide or display the cryptocurrency line using the checkbox.
- You can customize the color, opacity, and thickness of this plot by clicking the color box. Please do not change the color setting here if you also like to change the color of the labels – use the color options in the Inputs tab instead.
- The second box allows you to change the plot type and enable the Price Line. The Price Line is a horizontal line that keeps track of the plot’s current value. Changing the plot type is not recommended.
Overbought
This is a horizontal line which serves as a guide in indicating a currency has reached a state of overbought when its line crosses above this threshold. This line is displayed in RSI mode only.
- You can hide or display the Overbought line using the checkbox.
- You can customize the color, opacity, and thickness of this plot by clicking the color box. The default color is gray, and the thickness is set to 3.
- The second box allows you to choose a different line style.
- The text box defines the price level of the horizontal line. We recommend keeping its value at 80.
Oversold
This is a horizontal line which serves as a guide in indicating a currency has reached a state of oversold when its line crosses below this threshold. This line is displayed in RSI mode only.
- You can hide or display the Oversold line using the checkbox.
- You can customize the color, opacity, and thickness of this plot by clicking the color box. The default color is gray, and the thickness is set to 3.
- The second box allows you to choose a different line style.
- The text box defines the price level of the horizontal line. We recommend keeping its value at 20.
Labels
This option shows/hides the label objects used by the indicator. Please keep this option enabled.
Precision
This determines the number of decimal places the indicator uses to display the current value of its plots. You can adjust this by choosing from a drop-down list.
Alerts
The Cryptocurrency Strength Indicator (CCSI) has a total of 31 alert conditions.
Overbought
Alert Conditions
- USDT overbought
- Cryptocurrency 1 overbought
- Cryptocurrency 2 overbought
- Cryptocurrency 3 overbought
- Cryptocurrency 4 overbought
- Cryptocurrency 5 overbought
- Cryptocurrency 6 overbought
- Cryptocurrency 7 overbought
Condition
Triggers when the line (USDT, Cryptocurrency 1 to Cryptocurrency 7) is greater than or equal to 80 (overbought).
Alert message
For alerts of interchangeable cryptocurrencies, please specify the symbol by substituting it in the alert message.
Examples:
- USDT overbought at {value of USDT}
- [BTC] overbought at {value of Cryptocurrency 1}
- [ETH] overbought at {value of Cryptocurrency 2} … and so on
Oversold
Alert Conditions
- USD oversold
- Cryptocurrency 1 oversold
- Cryptocurrency 2 oversold
- Cryptocurrency 3 oversold
- Cryptocurrency 4 oversold
- Cryptocurrency 5 oversold
- Cryptocurrency 6 oversold
- Cryptocurrency 7 oversold
Condition
Quantum CCSI must be in RSI mode. Triggers when the line (USDT, Cryptocurrency 1 to Cryptocurrency 7) is less than or equal to 20 (oversold).
Alert message
For alerts of interchangeable cryptocurrencies, please specify the symbol by substituting it in the alert message.
Examples:
- USDT oversold at {value of USDT}
- [DOGE] oversold at {value of Cryptocurrency 6}
- [LTC] oversold at {value of Cryptocurrency 5} … and so on
Overbought or Oversold
Alert Conditions
- USDT OB/OS
- Cryptocurrency 1 OB/OS
- Cryptocurrency 2 OB/OS
- Cryptocurrency 3 OB/OS
- Cryptocurrency 4 OB/OS
- Cryptocurrency 5 OB/OS
- Cryptocurrency 6 OB/OS
- Cryptocurrency 7 OB/OS
Condition
- Triggers when the line (USDT, Cryptocurrency 1 to Cryptocurrency 7) is greater than or equal to 80 (overbought).
- Triggers when the line (USDT, Cryptocurrency 1 to Cryptocurrency 7) is less than or equal to 20 (oversold).
Alert message
For alerts of interchangeable cryptocurrencies, please specify the symbol by substituting it in the alert message.
Examples:
- USDT OB/OS at {value of USD}
- [ADA] OB/OS at {value of Cryptocurrency 3}
- [DOT] OB/OS at {value of Cryptocurrency 4} … and so on
USDT Cross
Alert Conditions
- Cryptocurrency 1 x USDT
- Cryptocurrency 2 x USDT
- Cryptocurrency 3 x USDT
- Cryptocurrency 4 x USDT
- Cryptocurrency 5 x USDT
- Cryptocurrency 6 x USDT
- Cryptocurrency 7 x USDT
Condition
Triggers when USDT crosses with the 7 cryptocurrencies.
Alert message
For alerts of interchangeable cryptocurrencies, please specify the symbol by substituting it in the alert message.
Examples:
- [BTC] x USDT cross detected at {value of Cryptocurrency 1}
- [ETH] x USDT cross detected at {value of Cryptocurrency 2}
- [XRP] x USDT cross detected at {value of Cryptocurrency 7} … and so on