Overview
Of all the four principal capital markets, the world of foreign exchange trading is the most complex and most difficult to master, unless of course you have the right tools! The reason for this complexity is not hard to understand.
First currencies are traded in pairs. Each position is a judgment of the forces driving two independent markets. If the GBP/USD for example is bullish, is this being driven by strength in the pound, or weakness in the US dollar. Imagine if we had to do the same thing trading stocks for example. Consider trading Google against Amazon. If this ‘pair’ were rising, is this being driven by strength in Google or weakness in Amazon? Almost impossible to analyze.
What’s The Problem?
To compound this problem, every currency can be bought or sold against a myriad of other currencies. This raises the next key question. If the GBP/USD is bullish once again, is the British pound strong against all the other major currencies, such as the GBP/JPY, the GBP/CAD, the EUR/GBP etc. If it is, then this is clearly a sign that the UK pound is being bought universally in the market. Equally for the US dollar, if it is sold universally in pairs such as the USD/CAD, the USD/JPY and others, then we can assume that the GBP/USD is rising as a result of strong buying of the pound universally, and strong selling across the market of the US dollar.
Finally, we come to the third problem, which is trying to assess the strength of this buying or selling. After all a currency may be overbought (strong) or oversold (weak) but how strong is strong, and how weak is weak.
Consider this for a moment. Assume you have decided to buy the GBP/USD and have the following information to help you in your analysis:
- Whether the GBP is also being bought in all the other cross currency pairs
- Whether the USD is also being sold in all the other major currency pairs
- The relative strength of buying in the GBP/USD pair
Trading Success
Trading success is all about assessing risk and the probability of success on each trade. Would this information give you a high risk, medium or low risk trading position? And the answer……… is a low risk trading opportunity. After all, you are now taking a position based on a view across the market.
First, if you are basing your decision on universal buying or selling of a currency, then you are trading with the entire weight of the market, and not just on the analysis of one currency pair – it’s low risk. Second, if you know the relative strength of this buying or selling against all the other currency pairs, then this gives you the complete picture – if its strong, then again – it’s low risk. Third and last, if you know what the counter currency is also doing in terms of strong or weak, then once more if its strong – it’s low risk.
The Currency Matrix Indicator For TradingView
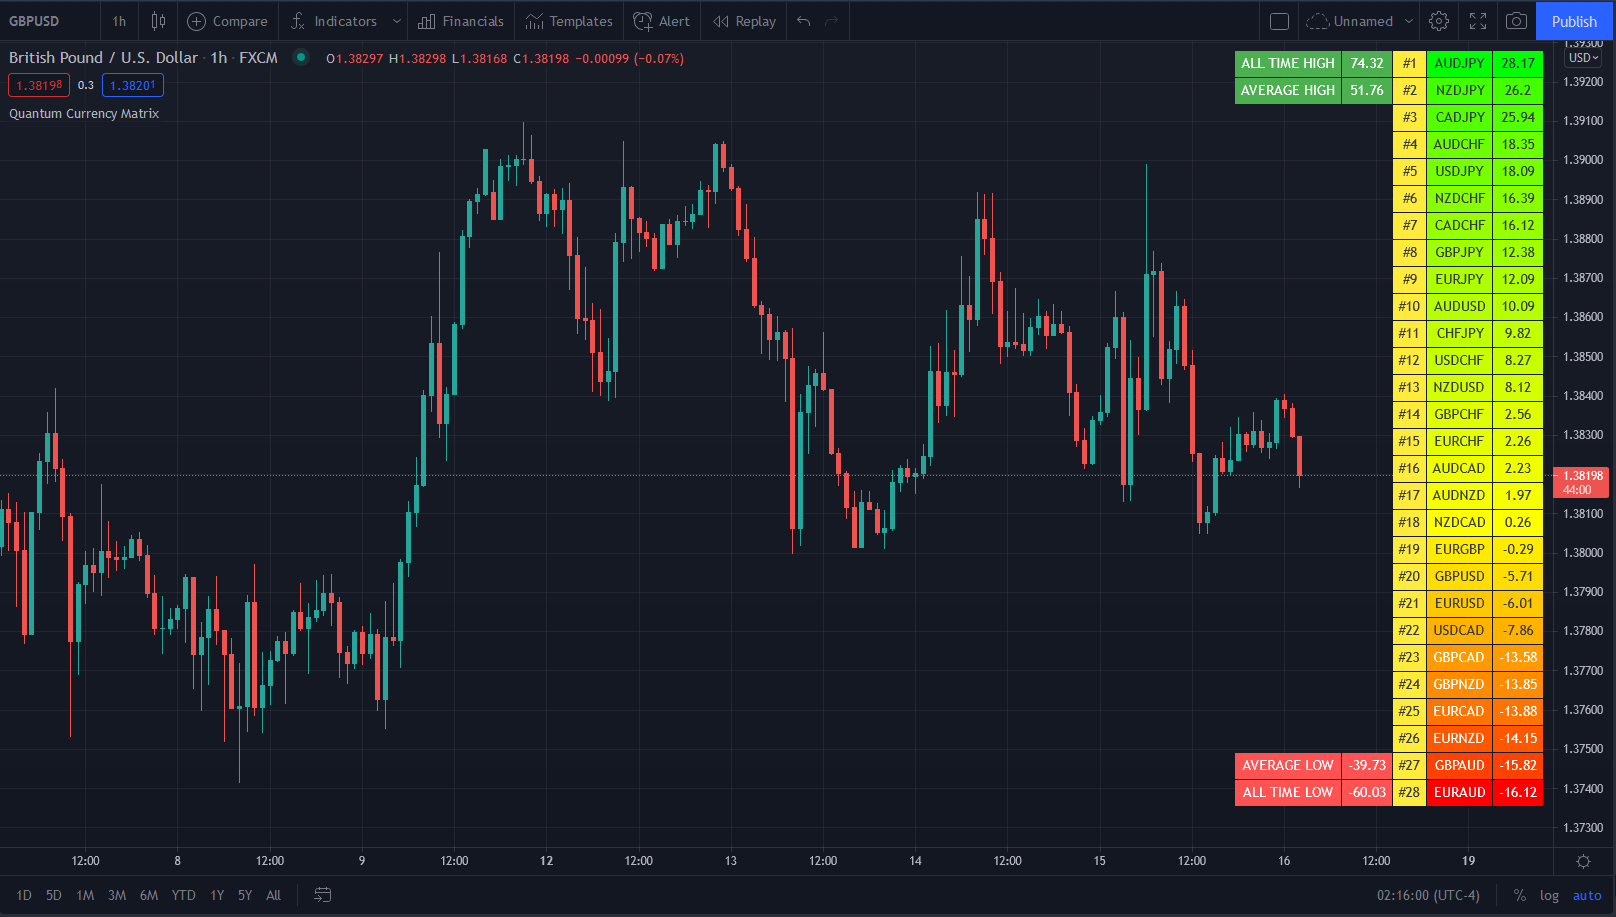
This is where the Quantum Currency Matrix steps in. It provides the solution to all three problems in one elegant indicator. It shows you the complete picture across the market in a simple matrix, which works in all timeframes from 1 minute to 1 month.
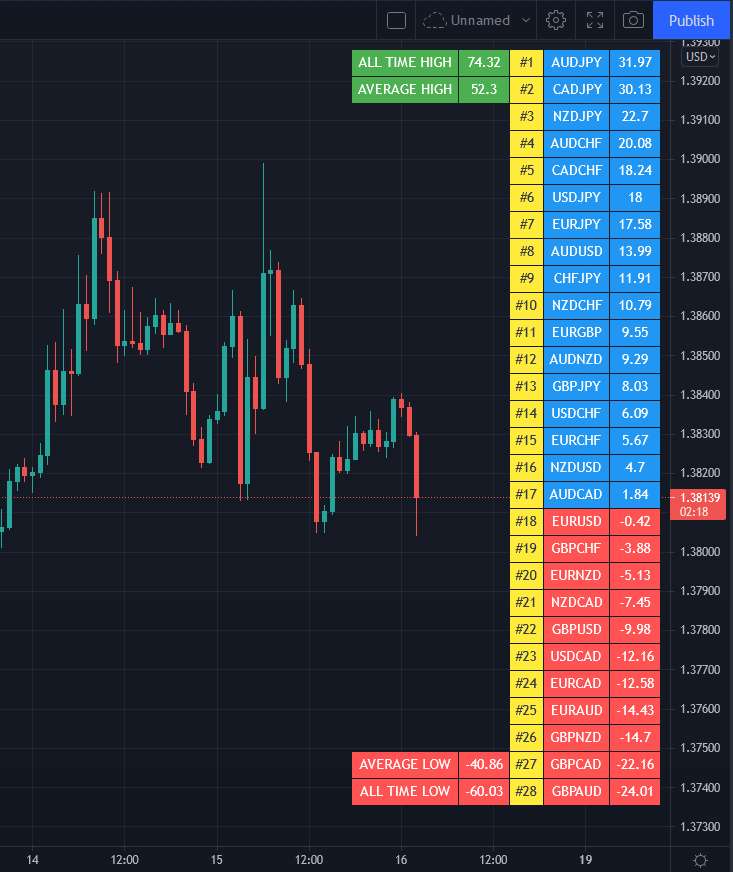
From the eight major currencies come the 28 currency pairs which are then displayed in a table, with their relative strength scores, updated second by second and minute by minute. As you can see, the Currency Matrix displays the complete spectrum of currency pair strength, from very bullish at the top of the matrix and bright green, to heavily bearish at the bottom of the matrix, and bright red. Those currency pairs moving up or down the ladder from bullish to bearish or bearish to bullish are then shaded in the transitional colors of orange, and yellow to light green.
Every pair is displayed with a ranking score. Above 0.00 indicates the pair is moving into a bullish phase, whilst a score below 0.00 indicates bearish momentum is increasing.
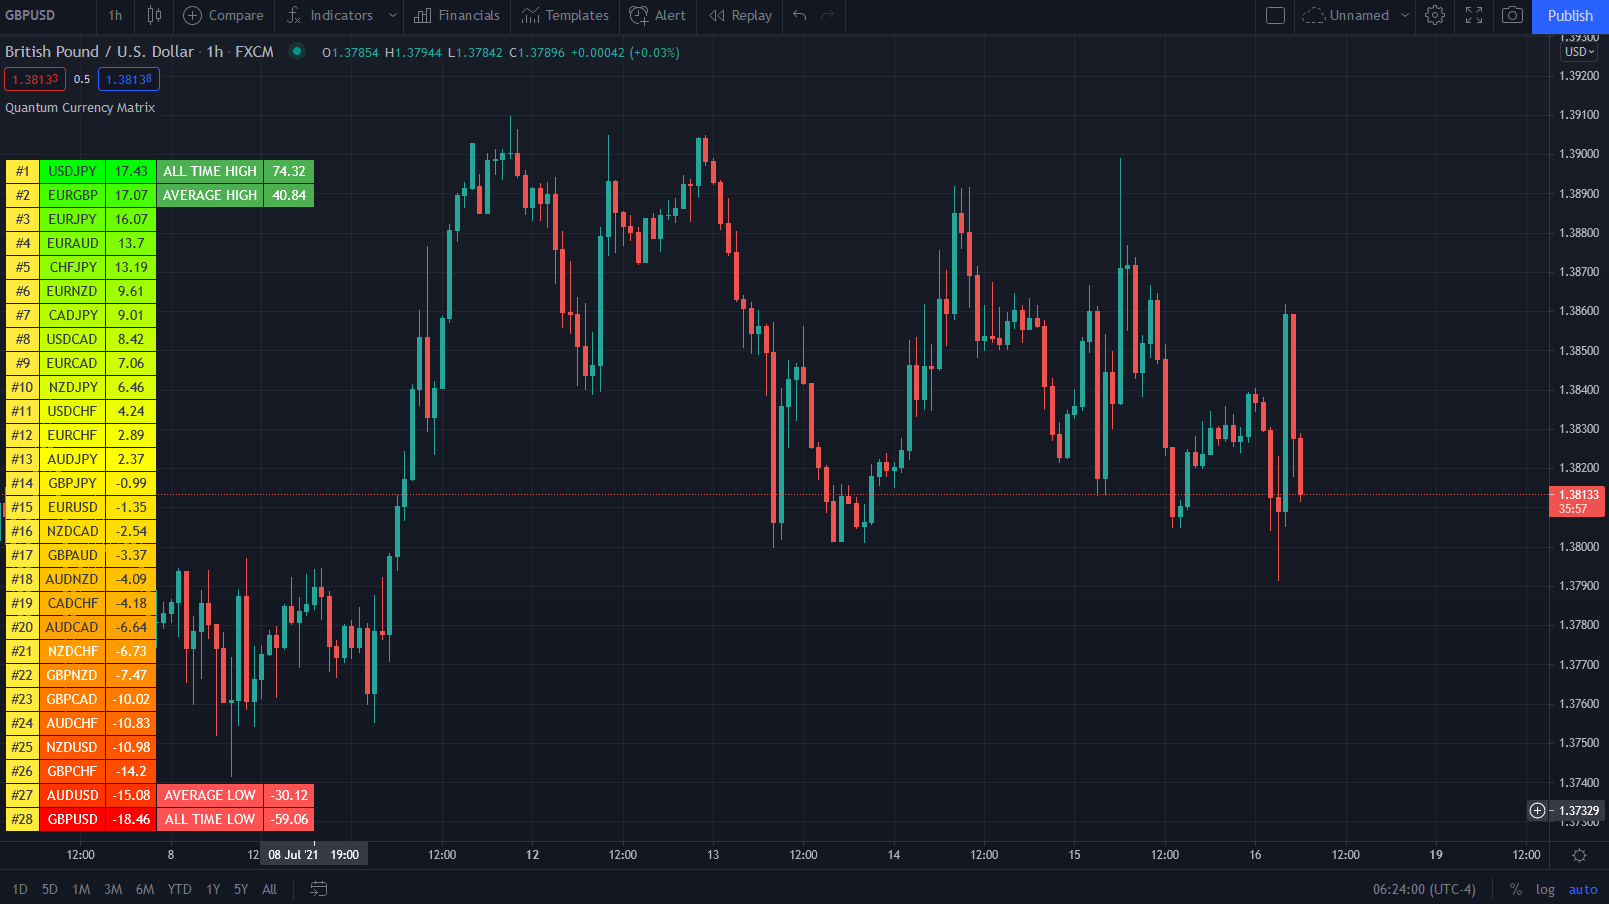
Each currency can then be isolated to show the 7 associated pairs and their relative scores. If all the associated pairs are showing similar strength (either bullish or bearish) then this is either a good time to join the move, or alternatively it may be an opportunity to wait for a reversal in trend as the pair becomes overbought or oversold.
The Quantum Currency Matrix gives you the tool to see the complexities of the Forex market in real time across all the related pairs, along with the strength of the buying and selling. Whilst it is possible to do this manually using multiple charts, what a manual matrix will not provide is any measure of the relative strength. The indicator does this for you automatically by considering the price action across all the related currency pairs and then deriving the relative strength scores accordingly. These are the ranking scores which you see displayed on each currency pair and by which they are ranked in the ladder.
Filter
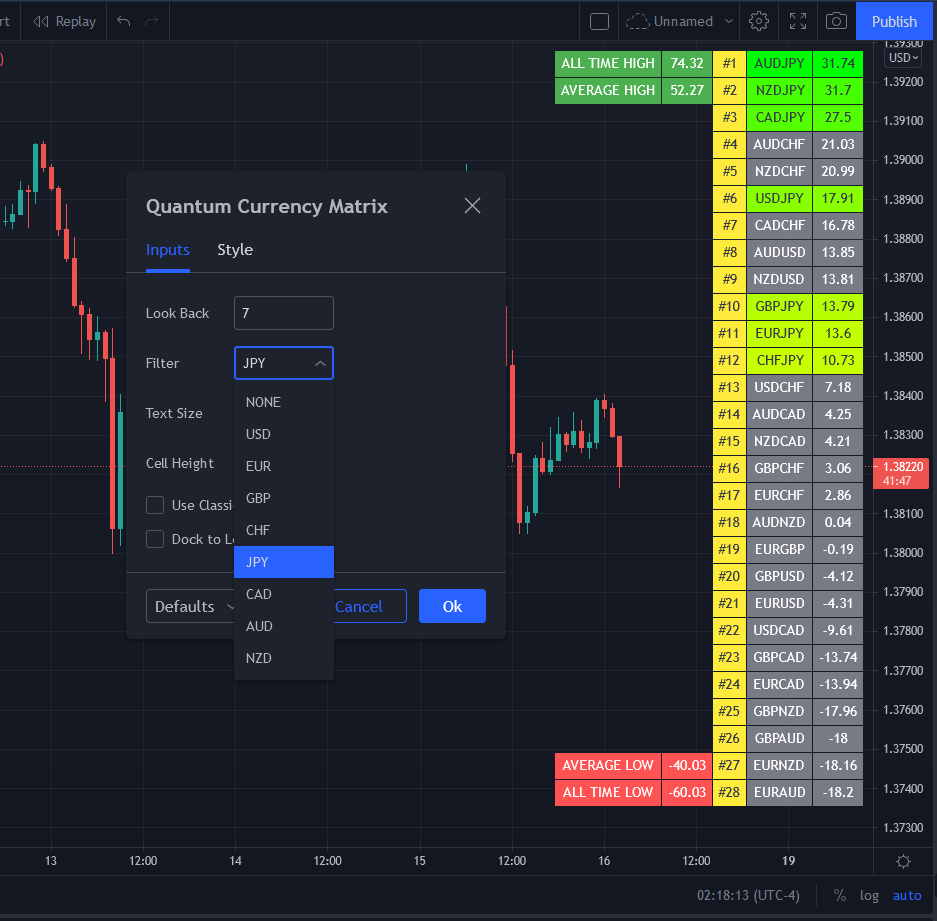
The Currency Matrix indicator allows you to filter the currency pairs relevant to the currency you are analysing. An input is provided in the indicator’s settings window which you can click to select a currency.
- USD selects all currency pairs that contain the US Dollar.
- EUR selects all currency pairs that contain the Euro.
- GBP selects all currency pairs that contain the British Pound.
- CHF selects all currency pairs that contain the Swiss Franc.
- JPY selects all currency pairs that contain the Japanese Yen.
- CAD selects all currency pairs that contain the Canadian Dollar.
- AUD selects all currency pairs that contain the Australian Dollar.
- NZD selects all currency pairs that contain the New Zealand Dollar.
Click the Filter option box and select a currency in the list to apply a filter. If you like to undo a filter, simply select NONE. When a certain currency filter is in effect, the currency pairs that include the selected currency in the matrix appear in color.
Extremes
“How does the strongest and weakest currency pairs in the matrix compare to the past strongest and weakest currency pairs within the period?”
This is the question that the “All time HIGH”, “Average HIGH”, “All time LOW”, and “Average LOW” numbers answer. These pieces of information are found beside the top-most and bottom-most currency pair in the matrix.
The following numbers are found at the left side of the top-most currency pair in the matrix:
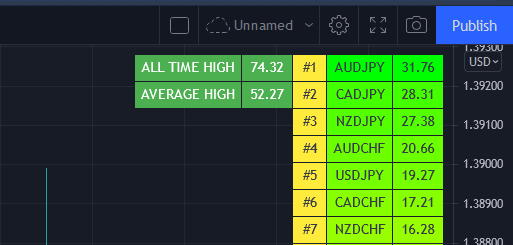
- All time HIGH – displays the highest score achieved by a currency pair within the period
- Average HIGH – displays the average highest score achieved by a currency pairs within the period
The following numbers are found at the left side of the bottom-most currency pair in the matrix:
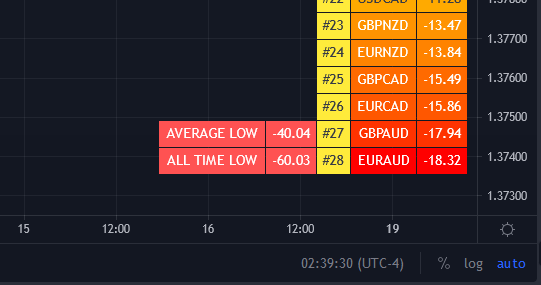
- All time LOW – displays the lowest score achieved by a currency pair within the period
- Average LOW – displays the average lowest score achieved by a currency pair within the period
Currency Dashboard
The Quantum Currency Matrix is a unique indicator. In an instant, you can see which pairs are rising strongly or falling strongly in every timeframe, and on a single chart. Whilst the Quantum Currency Strength Indicator gives you the heads up on individual currency strength and weakness, the Quantum Currency Matrix then delivers the global view for that currency in all the related pairs and for each timeframe – instantly, and giving you the tools to trade every pair with complete confidence.
By itself, the Quantum Currency Matrix indicator is a powerful trading tool for identifying trading opportunities quickly and easily. However, it was developed as part of what we like to call the Quantum Currency Dashboard which consists of the following indicators:
- Quantum Currency Strength Indicator (CSI)
- Quantum Currency Matrix
- Quantum Currency Array
- Quantum Currency Heatmap
These four indicators then provide a unique and compact insight into all the various aspects of strength and weakness for both currencies and currency pairs, from trend and momentum to overbought and oversold. What is unique is that using four charts, you are then able to monitor the myriad combinations of strength, weakness, momentum, congestion and divergence across the entire forex complex at a click of a button. And even more powerfully, giving you the confidence to get in and stay in for maximum profits. No more missed opportunities, no more struggling with multiple charts, and no more trader regret, whatever your trading style or approach.
Settings
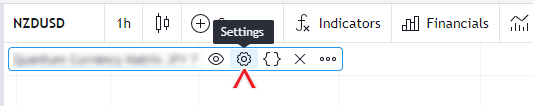
The Settings button appears as a small cog/gear icon beside the name of the indicator at the chart. Clicking the button shows a dialog box for configuring the Inputs and Style options.
Inputs
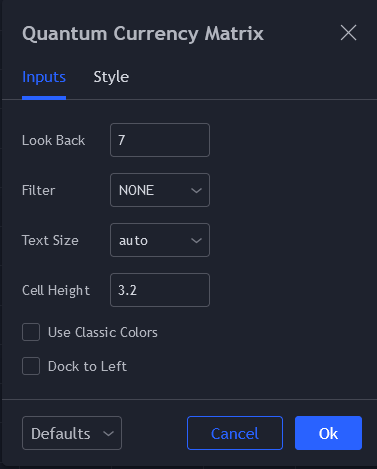
Look Back
This input allows you to set the period that the indicator uses to analyze the strength of the currency pairs. It represents the number of bars that has passed within the current timeframe. The default setting is 7 bars.
Filter
The Filter input is an option box that allows you to select 1 of the 8 major currencies that you like to highlight in the indicator. The currency pairs that include the selected currency will appear in color while the others turn grey. Selecting NONE will revert to the default setting with all the pairs appearing in color.
Text Size
This input sets the font size of the indicator and you can choose from the following options: auto, tiny, small, normal, large huge. The default value is auto which means that the text adapts to the size of the cell.
Cell Height
This input defines the height of each cell in the table and therefore, the entire indicator as well. You can decrease its value if the indicator is too large for your screen or increase its value if you have plenty of space in your screen. The default value is 3.2. You can set this input to 0 to allow each cell to adjust to the size of the text automatically.
Use Classic Colors
Instead of using a green-red gradient, the indicator switches to a dual color scheme when this input is ticked. When using classic colors, all currency pairs with a positive score are blue while the negative ones are red.
Dock to Left
You can enable this input option to change the position of the indicator from the right side to the left side of the chart.
Style
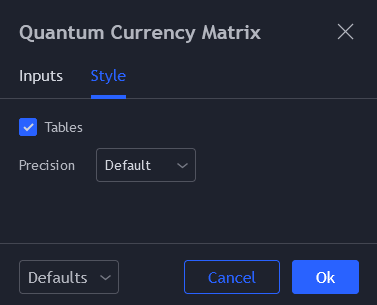
Tables
This option shows/hides the table object used by the indicator. Please keep this option enabled. The Currency Matrix is made entirely of a table object and disabling this option will hide everything in the indicator.
Precision
This setting have no effect in the indicator’s output.
Alerts
The Currency Matrix indicator has a total of 56 alert conditions.
Upper Extreme
Alert Conditions
- EURUSD Upper Extreme
- GBPUSD Upper Extreme
- USDCHF Upper Extreme
- USDJPY Upper Extreme
- USDCAD Upper Extreme
- AUDUSD Upper Extreme
- NZDUSD Upper Extreme
- EURGBP Upper Extreme
- EURCHF Upper Extreme
- EURJPY Upper Extreme
- EURCAD Upper Extreme
- EURAUD Upper Extreme
- EURNZD Upper Extreme
- GBPCHF Upper Extreme
- GBPJPY Upper Extreme
- GBPCAD Upper Extreme
- GBPAUD Upper Extreme
- GBPNZD Upper Extreme
- CHFJPY Upper Extreme
- CADCHF Upper Extreme
- CADJPY Upper Extreme
- AUDCHF Upper Extreme
- AUDJPY Upper Extreme
- AUDCAD Upper Extreme
- AUDNZD Upper Extreme
- NZDCHF Upper Extreme
- NZDJPY Upper Extreme
- NZDCAD Upper Extreme
Condition
Triggers when the currency pair is greater than or equal to the AVERAGE ALL TIME HIGH.
Alert message
Examples:
- EURUSD at upper extreme
- GBPCHF at upper extreme
- CADJPY at upper extreme … and so on
Lower Extreme
Alert Conditions
- EURUSD Lower Extreme
- GBPUSD Lower Extreme
- USDCHF Lower Extreme
- USDJPY Lower Extreme
- USDCAD Lower Extreme
- AUDUSD Lower Extreme
- NZDUSD Lower Extreme
- EURGBP Lower Extreme
- EURCHF Lower Extreme
- EURJPY Lower Extreme
- EURCAD Lower Extreme
- EURAUD Lower Extreme
- EURNZD Lower Extreme
- GBPCHF Lower Extreme
- GBPJPY Lower Extreme
- GBPCAD Lower Extreme
- GBPAUD Lower Extreme
- GBPNZD Lower Extreme
- CHFJPY Lower Extreme
- CADCHF Lower Extreme
- CADJPY Lower Extreme
- AUDCHF Lower Extreme
- AUDJPY Lower Extreme
- AUDCAD Lower Extreme
- AUDNZD Lower Extreme
- NZDCHF Lower Extreme
- NZDJPY Lower Extreme
- NZDCAD Lower Extreme
Condition
Triggers when the currency pair is less than or equal to the AVERAGE ALL TIME LOW.
Alert message
Examples:
- EURUSD at lower extreme
- GBPCHF at lower extreme
- CADJPY at lower extreme … and so on