Overview
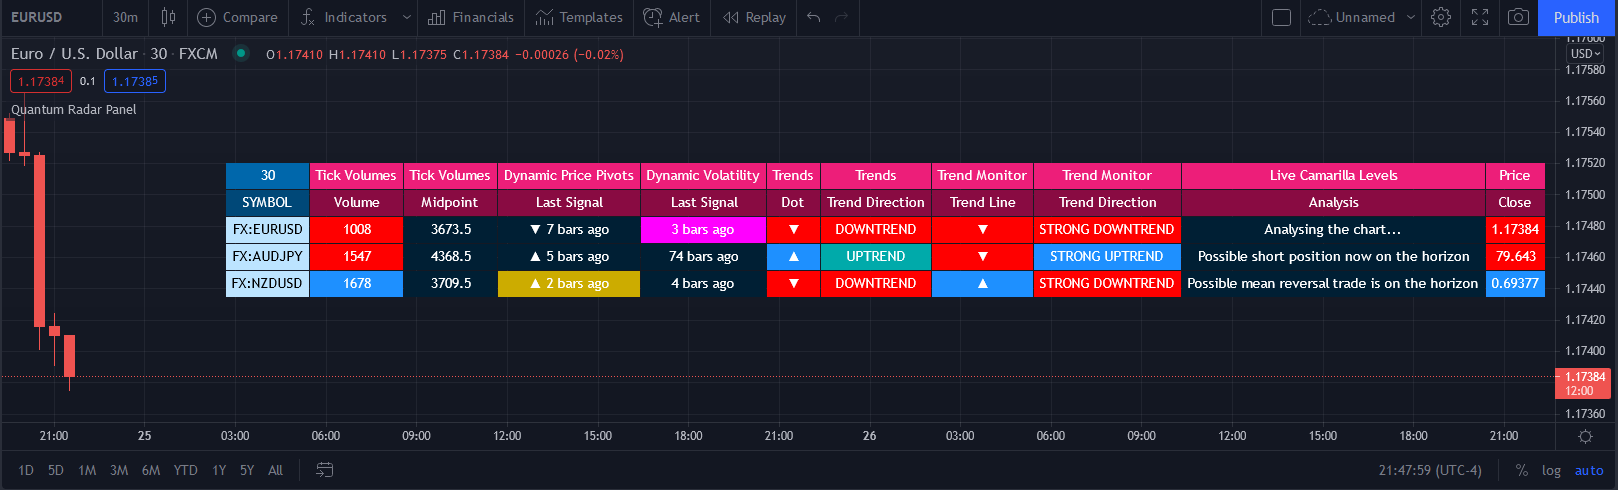
One of the biggest issues trading any market is in keeping track of trading opportunities as they arise across all the various timeframes without having multiple monitors or charts open, and this is where the Radar Panel steps in. Using TradingView’s Table function, we have incorporated a host of our leading indicators on the panel, which can be applied to any timeframe and from which you can instantly spot opportunities as they arise, whether in terms of trend, reversals, volatility, or volume. In addition, when using a scanner such as this, it also highlights broad sentiment if, for example, you have added currency pairs from the same matrix or a group of stocks from the same sector. And you can, of course, have multiples open across the various timeframes.
The Quantum Radar Panel is a powerful indicator that tracks signals from up to 10 different symbols in real time. For each symbol, it can display the current signals of 6 Quantum Trading indicators, namely:
- Quantum Tick Volumes
- Quantum Dynamic Price Pivots
- Quantum Dynamic Volatility
- Quantum Trends
- Quantum Trend Monitor
- Quantum Live Camarilla Levels
It can also display the current Open, High, Low, and Close prices of each symbol. Each indicator has 1 or more columns to display information about its signals. Below, we will discuss what each indicator does and how it displays its signals in the Radar Panel.
Tick Volumes
Volume is a powerful leading indicator, yet few traders ever take advantage of it. Why? Because identifying volume trends using the standard indicator can be confusing, and judging volume height even more so!
The Quantum Tick Volumes indicator turns a simple tool into a powerful one! First, it paints the volume bar to match the candle. This makes it quick and easy to identify buying and selling volume with the associated price action.
Second, the Quantum Tick Volume indicator displays a dynamic mid-point, instantly telling you whether volumes are high, average or low in the session. No more guesswork! Volume analysis made simple – making it easy to spot profitable trading opportunities – fast!
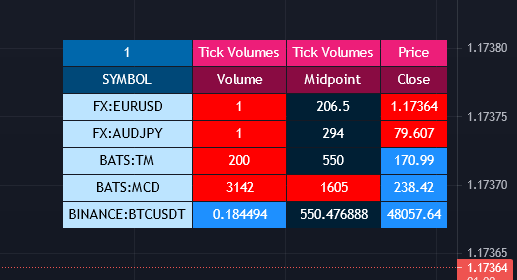
In the Radar Panel, the Tick Volumes indicator displays 2 columns -Volume and Midpoint.
Columns
- Volume – this column displays the current volume of the symbol and changes colours according to the sentiment of the current candle.
- Blue – if the current candle is bullish
- Red – if the current candle is bearish
- Midpoint – this column displays half of the highest volume bar within the current da,y and it is visible in intraday timeframes only
Dynamic Price Pivots
The Quantum Dynamic Price Pivots indicator could best be described as the Swiss army knife of trading. Power, simplicity and functionality all in one tool. Many traders struggle to identify reversal points solely from price action. Why? Because you need a complete understanding of candlesticks, candles, and candle patterns.
The dynamic pivot appears once a three-candle price pattern is created. This is one of the first signs of a possible change in sentiment, based solely on price action. A pivot high in an uptrend, and a pivot low in a downtrend. So, whether you are trading long or short, the Quantum Dynamic Price Pivots indicator will instantly give you a visual signal to – pay attention! Powerful, yet so simple, and two indicators in one!
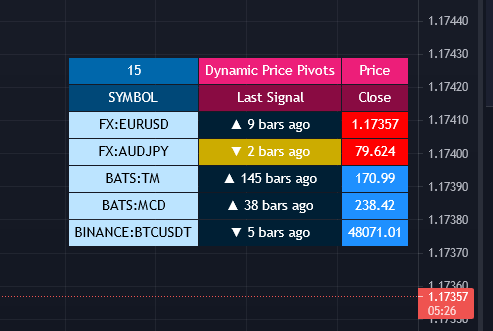
In the Radar Panel, the Dynamic Price Pivots indicator displays the last signal (isolated high or isolated low) and the number of bars since it was last seen.
Column
- Last Signal – this column displays the last pivot arrow that appeared in the chart in the form of an upward (isolated low) or downward (isolated high) arrow and the number of bars since it was detected. The cell turns yellow when the arrow is seen in the last 3 bars or less.
- ▼ – isolated high
- ▲ – isolated low
Dynamic Volatility
Volatility can be both good and bad. Great for making money fast. Not so good when you’re on the losing side! But how do you know when a market is volatile? Is the price action you are seeing normal for that currency pair? And more importantly, what is normal?
The Quantum Dynamic Volatility indicator is designed with one objective in mind. To show you, dynamically volatile price action. You then decide, based on the price action, whether to wait or take advantage. One of the hardest things to learn in trading is when to stay out. The Quantum Dynamic Volatility indicator makes this child’s play – keep you safe. It could almost be called your safety belt!
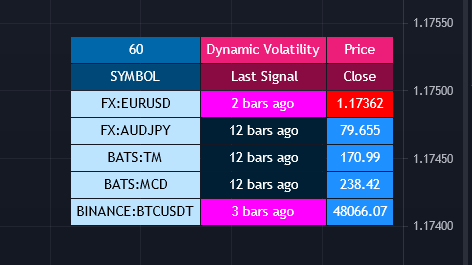
In the Radar Panel, the Dynamic Volatility indicator displays the number of bars since a volatile candle was last seen.
Column
- Last Signal – this column displays the number of bars since a volatile candle was detected. The cell turns magenta when the signal is seen in the last 3 bars or less.
Trends
All traders know that price is a leading indicator. Yet few traders ever discover how to correctly interpret the start of a new trend, or indeed the end of an old one. To add further complexity, markets spend over 70% of their time in congestion, moving sideways in a narrow range. The traders worst enemy.
What’s the answer? Step forward – the Quantum Trends indicator. With this simple and elegant indicator, dynamic trends are painted for you in real time. In trading any market, you need to be quick on your feet, and the Quantum Trends indicator delivers in spades! But even better, not only will it signal your possible entry and exit, but it also signals a market in congestion – equally important. Knowing when to stay out is just as important as knowing when to get in.
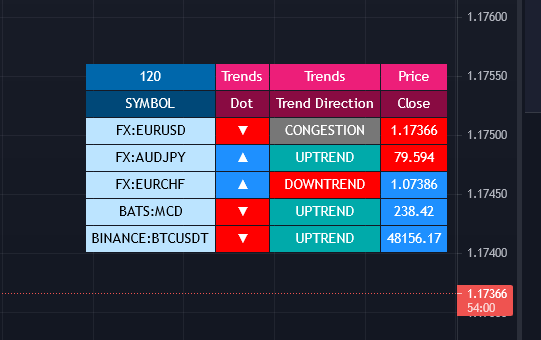
In the Radar Panel, the Trends indicator displays where the last trend dot is heading and the sentiment of the dot or the trend direction.
Columns
- Dot – this column shows whether the current trend dot is going up, down, or sideways.
- ▼ – the position of the previous dot is higher than the current one (red colour)
- ▲ – the position of the previous dot is lower than the current one (blue colour)
- ► – the position of the previous dot is the same as the current one (black colour)
- Trend Direction – this column displays the sentiment of the current trend dot and its colour
- UPTREND – blue
- DOWNTREND – red
- CONGESTION – gray
Trend Monitor
One of the hardest things to do in trading is to stay in and take the maximum profit from any position. You know how it goes. You get in, and all is going well. Then the market reverses. You get frightened and close out. What happens next?
Yes, you guessed it – the market reverses again and starts to move fast. Now it’s too late. You have missed out on some great profits, and are left wishing you had stayed in.
That’s why we developed the Quantum Trend Monitor. It does just that. The panel monitors the trend’s strength. It will help you stay in when your emotions are telling you to get out. The Trend Monitor will give you the confidence, not just to stay in, but to take the maximum profit from each and every trade.
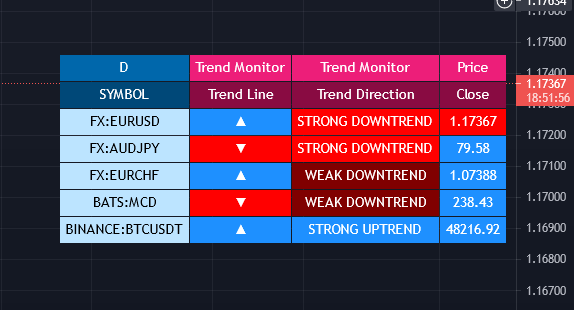
In the Radar Panel, the Trend Monitor indicator displays where the trend line (one of Trend Monitor’s 2 modes) is heading at and the current sentiment or trend direction.
Columns
- Trend Line – in the indicator proper, the trend line shows the progression or steepness of the trend’s momentum, and this information is simplified as the direction of the line, whether it is going upwards, downwards, or sideways.
- ▼ – the trend line is moving downwards (red colour)
- ▲ – the trend line is moving upwards (blue colour)
- ► – the trend line is moving sideways (black colour)
- Trend Direction – this column displays the current sentiment and its colour
- STRONG UPTREND – blue
- WEAK UPTREND – dark blue
- STRONG DOWNTREND – red
- WEAK DOWNTREND – dark red
Live Camarilla Levels
What is the Camarilla protocol, how does it work and what will it do for me?
Put simply it is a chameleon of an indicator and will appeal whether you are a more discretionary type of trader, making and taking decisions yourself, or if you prefer a more systematic or mechanical approach often associated with an EA for example. With the Camarilla levels indicator both approaches can be embraced and accommodated.
The Camarilla protocol has its roots in the open outcry trading pits, where traders considered floor pivots an essential tool. Based on these original ideas and incorporating the Camarilla equation we have developed a unique indicator which delivers clear and precise price-based support and resistance levels, which act as targets for profits, triggers for potential reversals, signals for possible breakouts, and finally stop loss placement. So, if you’re a swing or reversal trader, it’s the perfect indicator. Equally if you prefer breakout trading, again it’s the perfect indicator. And all with predetermined and clear levels for any price objectives and profit targets, with stop loss placement covered also.
In other words, a complete indicator, and one which is delivered with potential trading setups built in to help you see when key levels are being approached or breached. And to help you further when using the indicator, we have also included some simple messages to guide you as the various levels are approached and tested.
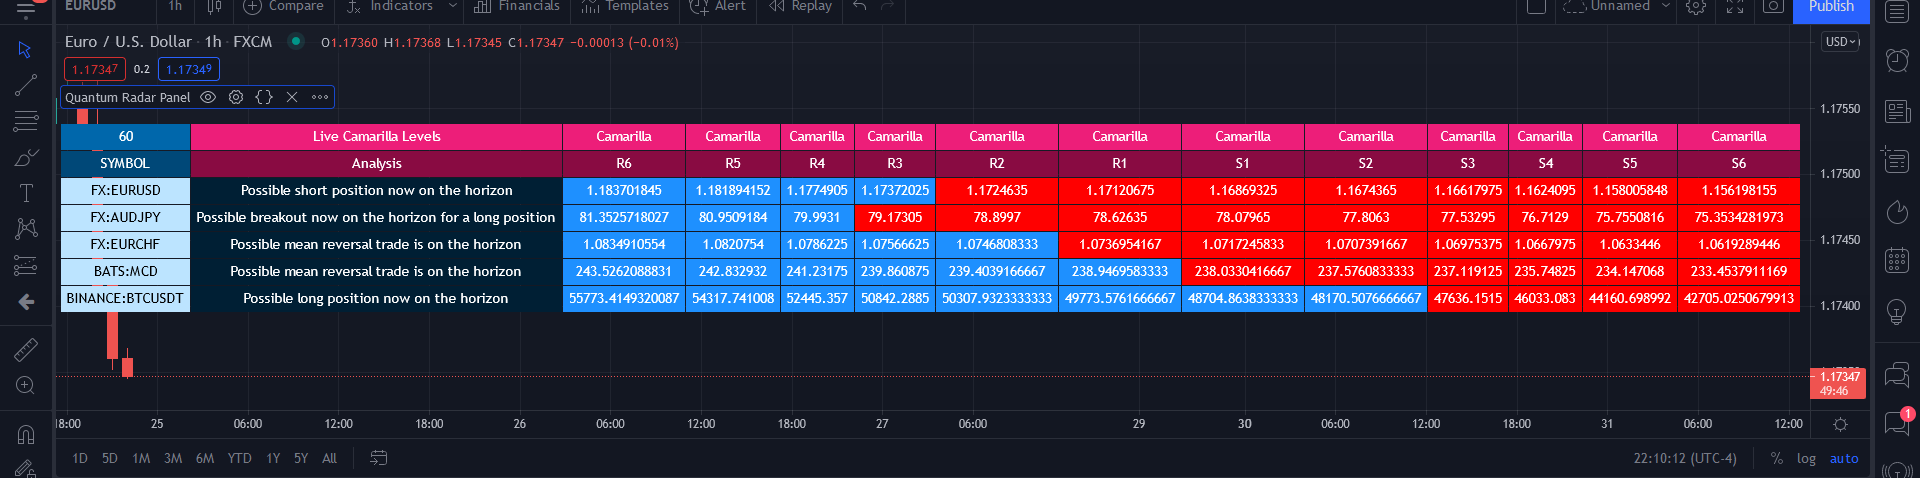
In the Radar Panel, the Live Camarilla Levels indicator displays the 12 Camarilla levels in descending order, R6 to R1 and S1 to S6, as well as the Analysis based on where the current price is situated among the 12 levels.
Columns
- Analysis – this column displays messages that can guide you as the various levels are approached and tested.
- If the current open price is between R3 and S3 the indicator displays the words – Possible mean reversal trade is on the horizon
- If the current open price is between S3 and S2 the indicator displays the words – Possible long position now on the horizon
- If the current open price is between R3 and R2 the indicator displays the words – Possible short position now on the horizon
- If the current open price is between R3 and R4 the indicator displays the words – Possible breakout now on the horizon for a long position
- If the current open price is between S3 and S4 the indicator displays the words – Possible breakout now on the horizon for a short position
- When there is nothing of interest, the indicator displays the message – Analysing the chart…
- R6 – R1, S1 – S6 (12 columns) – these columns display the 12 Camarilla levels calculated for the current timeframe and each one changes colors depending on the current price
- Red – the Camarilla level is below the current price
- Blue – the Camarilla level is above the current price
OHLC Prices
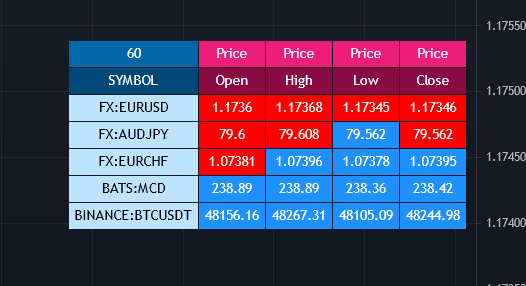
Apart from the 6 Quantum indicators, the Radar Panel also displays the current OHLC prices of each symbol.
- Open
- High
- Low
- Close
Their color changes depending on the current price action.
- Blue – if the current price is greater than the price in the previous candle
- Red – if the current price is less than the price in the previous candle
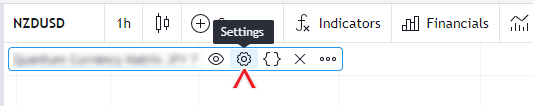
Settings
The Settings button appears as a small cog/gear icon beside the name of the indicator at the chart. Clicking the button shows a dialog box for configuring the Inputs and Style options.
Inputs
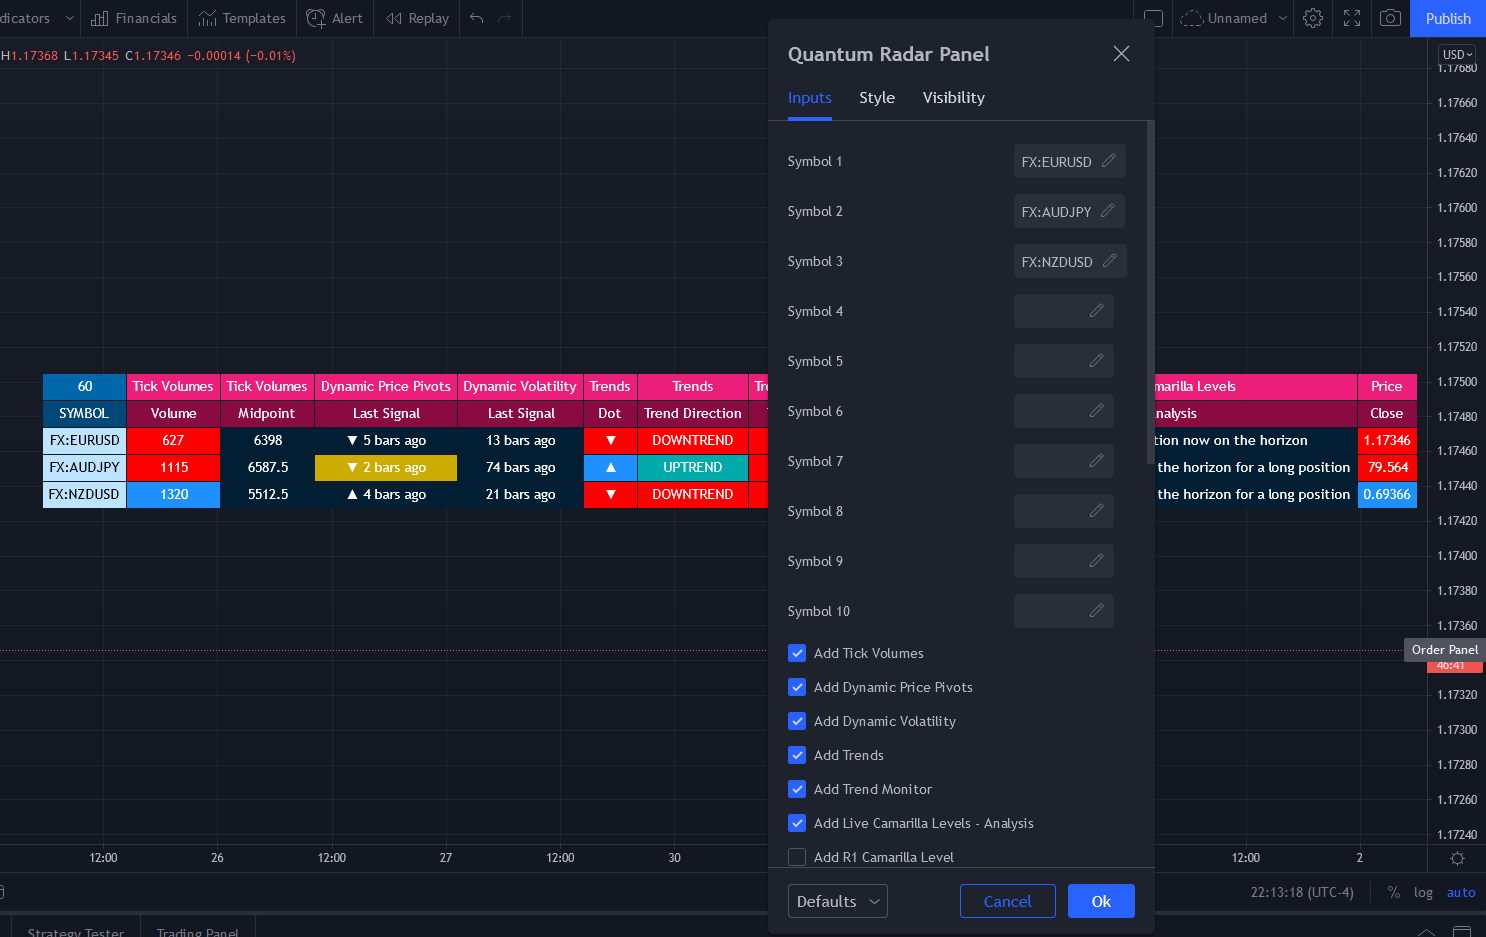
Symbol 1 – Symbol 10
This series of 10 inputs allows the user to define up to 10 different symbols which the Radar Panel will include in its calculations. Clicking the these inputs will display a Change Symbol window to help you search your desired symbol. The specified symbols are displayed in order from Symbol 1 to Symbol 10 in the Radar Panel.
Add Tick Volumes
This input adds/removes the Tick Volumes indicator columns in the Radar Panel.
Add Dynamic Price Pivots
This input adds/removes the Dynamic Price Pivots indicator column in the Radar Panel.
Add Dynamic Volatility
This input adds/removes the Dynamic Volatility indicator column in the Radar Panel.
Add Trends
This input adds/removes the Trends indicator columns in the Radar Panel.
Add Trend Monitor
This input adds/removes the Trend Monitor indicator columns in the Radar Panel.
Add Live Camarilla Levels – Analysis
This input adds/removes the Analysis column of the Live Camarilla Levels indicator in the Radar Panel.
Add R1 Camarilla Level – Add R2 Camarilla Level, Add S1 Camarilla Level – Add S6 Camarilla Level
This series of inputs adds/removes the columns that display the 12 support and resistance Camarilla levels from the Live Camarilla Levels indicator in the Radar Panel.
Add Open Price
This input adds/removes the Open price column in the Radar Panel.
Add High Price
This input adds/removes the High price column in the Radar Panel.
Add Low Price
This input adds/removes the Low price column in the Radar Panel.
Add Close Price
This input adds/removes the Close price column in the Radar Panel.
Dynamic Volatility – Sensitivity
This input allows you to tune the Sensitivity parameter of the Dynamic Volatility indicator.
You can increase the value of this input by increments of 1 to allow the indicator to become more sensitive to bars that exhibit volatility.
Trends – Sensitivity to Congestion
This input allows you to tune the Sensitivity to Congestion parameter of the Trends indicator.
This user input has been provided to allow you to fine-tune the indicator to your own trading style and attitude to risk. Increasing its value makes the indicator more sensitive to detecting congestion phases of price action. This means you will see more of the grey dots which are early signs of potential weakness in the respective trends.
This is a personal choice, and a user input we have included to allow you to have control over the indicator, and whether you want to be alerted earlier to potential weakness or pauses in the trend or are happy to wait before such changes are signaled slightly later, and over shorter periods on the indicator. This is your choice and so can be configured to your own trading style and attitude to risk.
Trend Monitor – Tolerance
This input allows you to tune the Tolerance parameter of the Trend Monitor indicator.
Tolerance is a factor used by the indicator to smooth out the noise in the chart’s price action. As you increase its value, easing in and out of stronger trends become more apparent.
Dock to Left
You can enable this input to change the position of the Radar Panel on the chart. When ticked, the table is displayed at the left side.
Text Size
This input sets the size of the text in the Radar Panel and also affects the overall size of the entire table.
Cell Height
This input sets the size of each cell in the Radar Panel and
Style
Tables
This option shows/hides the table object used by the indicator. Please keep this option enabled. The Radar Panel is made entirely of a table object and disabling this option will hide everything in the indicator.