rview
If you are a more experienced trader, you might have come across the word “renko” or have seen it in trading forums and communities. It refers to a Japanese charting technique that is extremely popular among traders because of the particular way it plots price action. And it does this by removing time, and in effect focuses on price action delivering smooth trends and clear congestion phases. More importantly however it reveals momentum since it is independent of time and so as the market speeds up, so does the chart, and vice versa. This is a concept you would not see in a normal time-based chart.
Each bar is created when the price exceeds the previous bar’s high or low by a predefined amount or what we call the box size or brick size. This gives the renko chart a pleasant appearance of equally sized bars running up or down in 45-degree angles. This delivers some great advantages.
What It Will Do For You
First, it allows traders to focus solely on price as the chart filters out all minor price fluctuations and market “noise”. This makes it easier for traders not only to identify strong moves but also to spot significant turning points, and so deploy smarter entries and exits.
Second, a renko chart helps traders in what is probably one of the most difficult aspects of trading, namely staying in a position once a move is underway. The renko chart does this by displaying price momentum as it speeds up and slows down and it does this because a renko chart is devoid of time.
Finally, because the bricks are drawn at 45-degree angles from each other, the charts are easier to read and to analyze.
Unfortunately, on TradingView the renko chart is extremely limited for free users and the Quantum Renko indicator offers a great solution with some exciting new features.
Dual Mode
You can use the Quantum Renko indicator for TradingView in 2 different ways.
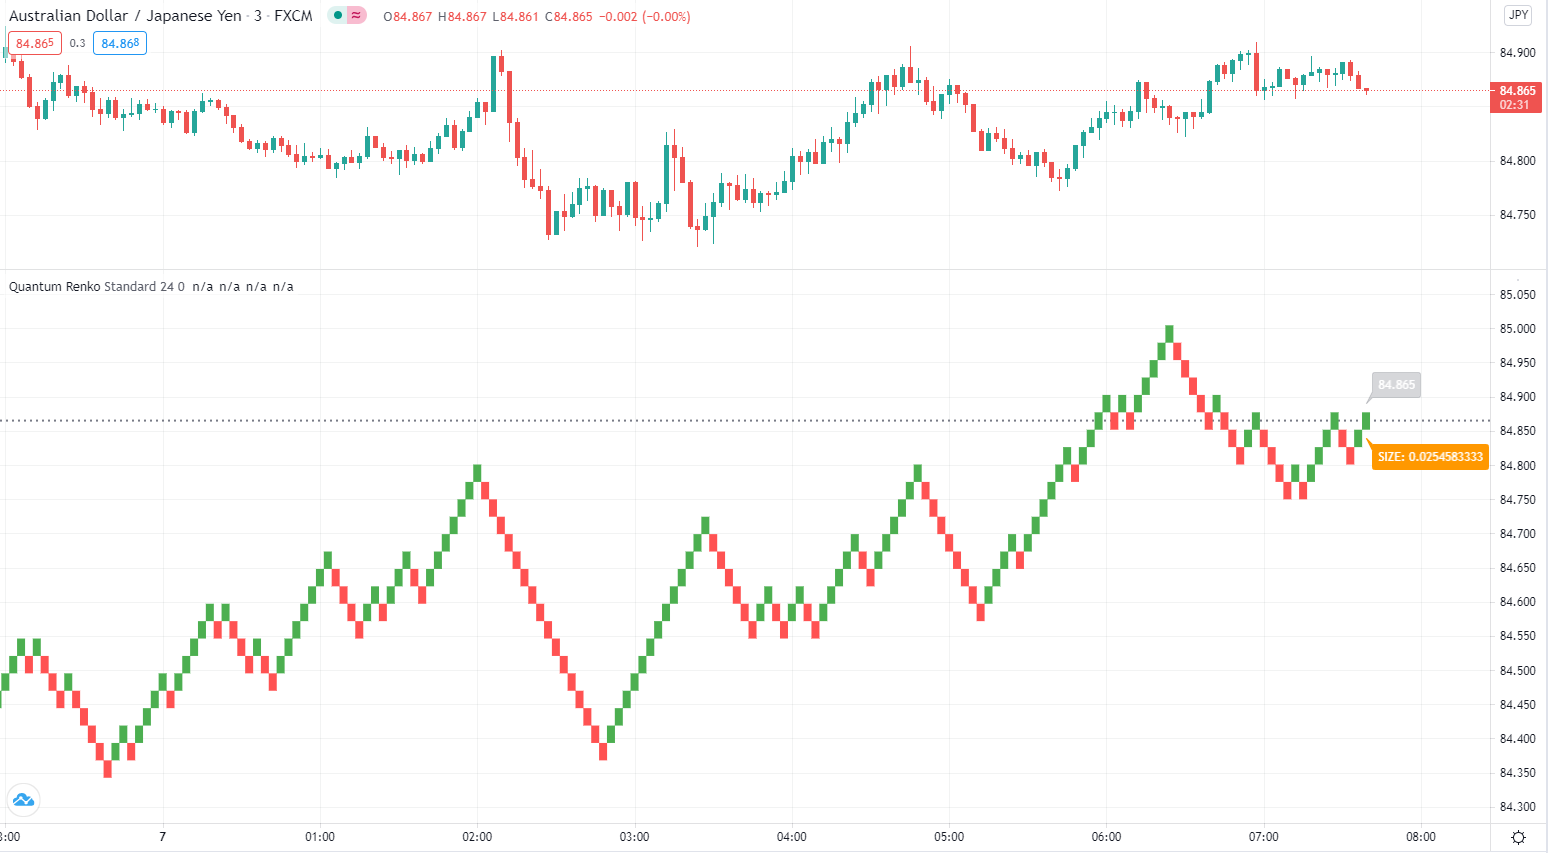
Standard
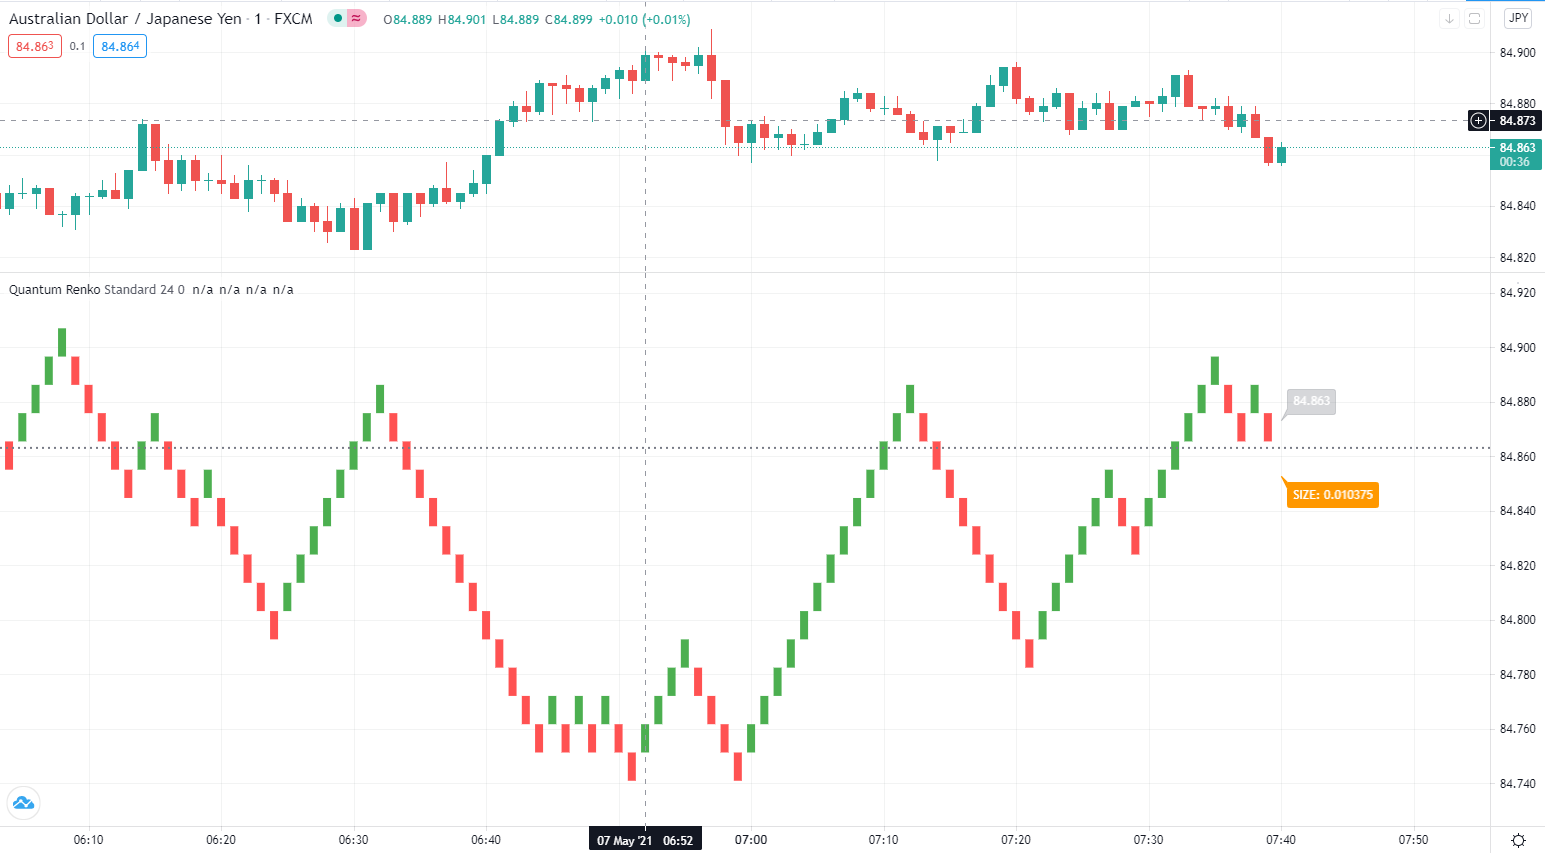
When applied, the Quantum Renko indicator appears below the main chart and creates a renko chart representation of the time-based chart above. Please note that in Standard mode, and since renko charts are devoid of time, the time x-axis of the chart does not apply to the renko chart displayed. Right off the bat, the Dynamic Renko indicator takes the time-based chart above and calculates the best box size that matches the current timeframe then uses it to create the renko bars below. The computed box size is displayed at the right-hand side of the renko chart’s last bar. It can also accept a fixed box size by entering it in the indicator’s Fixed Box Size input.
Time-accurate
The renko chart is a powerful approach for an intra-day trader, as it smooths out price action into a series of blocks or steps, delivering a uniform chart that is easy to analyse. And of course, being a non-time-based chart, it reveals momentum as the price action speeds up and slows down, which is invaluable when scalping. However, there is a problem. As it is a non-time-based chart, it can be tricky to align this with a time-based chart as the two are not synchronised.
So, when a trader runs the Renko alongside a time-based chart, using one to analyse the other and vice versa, it is almost impossible to align the two correctly. This is even more significant when using indicators on the time-based chart, such as volume, third-party proprietary indicators, or freely available indicators. So, what’s the answer?
What Will It Do
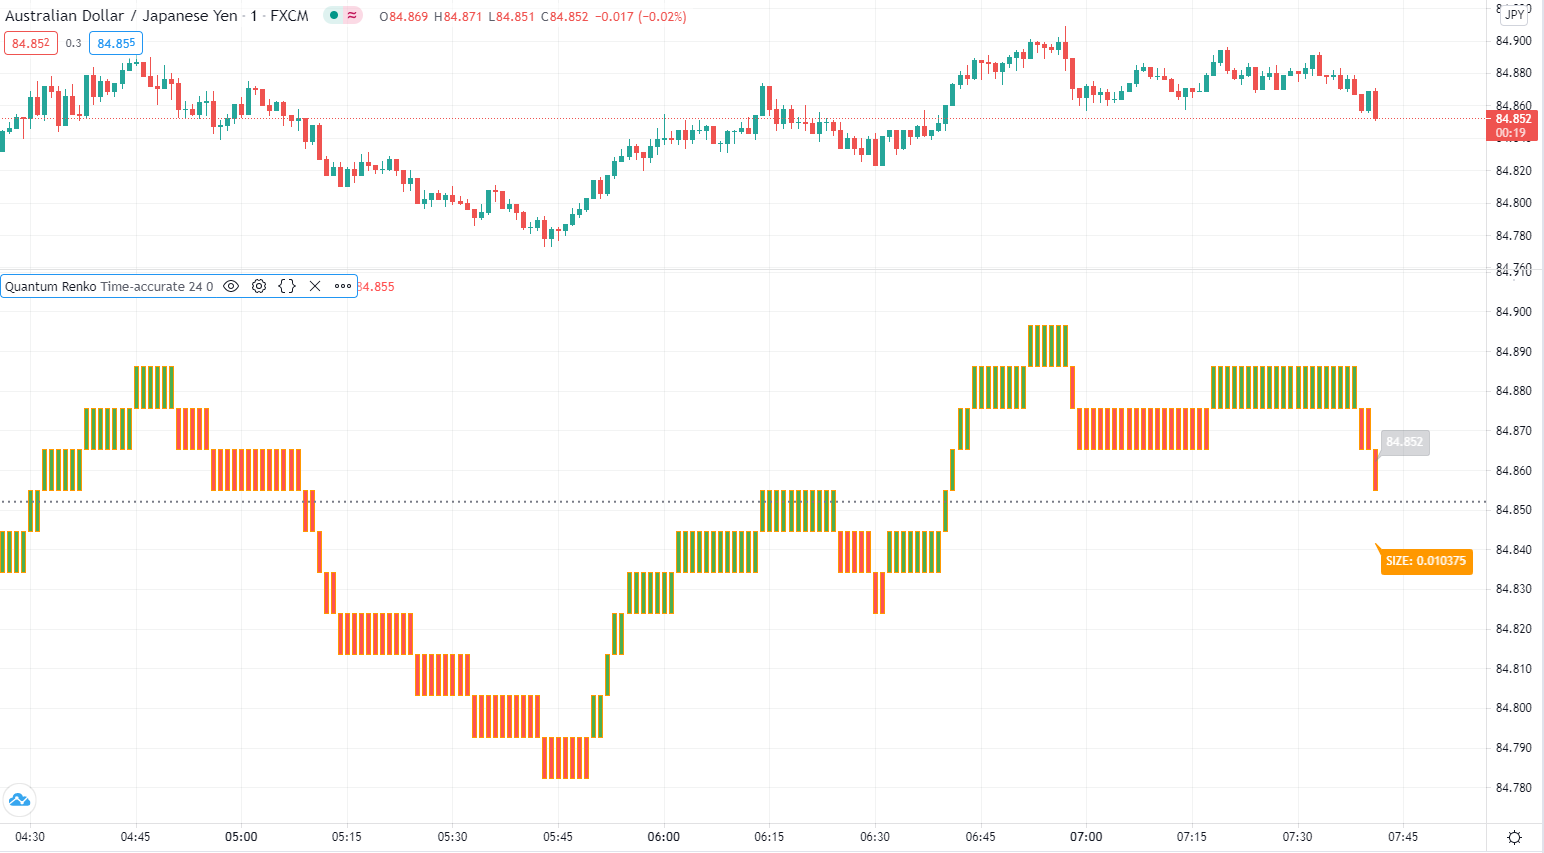
The Time-accurate renko indicator solves the issue instantly. It is unique and as far as we know nobody has developed such an indicator to provide a solution to this problem. So how does it work? And as you might expect the answer is all in the name. We call it the Time-accurate renko indicator because that’s what it is. In simple terms it aligns the bricks it builds with the time-based chart above. So where for example the time-based price action moves into congestion, so does the time accurate renko and will build a horizontal wall of bricks at that level until the price action breaks away, at which point the Time-accurate renko begins building in the normal way with bricks which rise or fall with the trend.
What The Indicator Delivers
What the chart then delivers is a wonderful picture of clear levels of support and resistance, as you might see when a brick wall is under construction. It helps traders to establish breakaway price action, which all the time is mirrored on the time-based chart with the chosen indicators. What makes the time-accurate Renko even more powerful is the option to select either your own choice of brick size or alternatively the optimised version, which means you are trading in harmony with the market. The optimal setting is derived from calculations based on average true range and delivers the perfect brick size for all markets, timeframes and session times, so there is no more guesswork. The indicator does it all for you. However, if you prefer to set your own brick size this is available also.
And the best news of all, is that the Time-accurate renko is included with the Standard renko, so you have two indicators for the price of one and can switch from one to the other at any time or perhaps run both. The choice is yours with this unique combination of renko indicators.
Settings
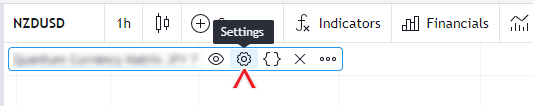
The Settings button appears as a small cog/gear icon beside the name of the indicator at the chart. Clicking the button shows a dialog box for configuring the Inputs and Style options.
Inputs
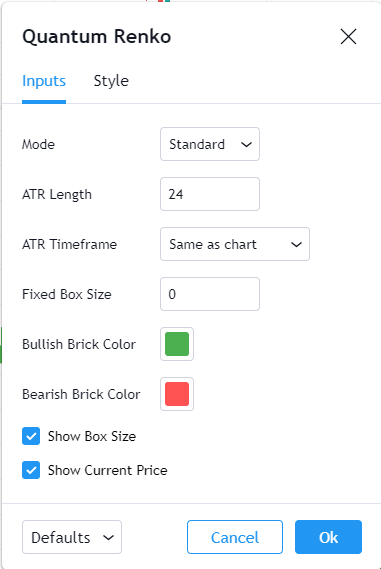
Mode
This input allows you to switch between the 2 modes of the indicator: Standard and Time-accurate modes.
Standard mode
In Standard mode, the renko bricks are displayed in a traditional manner, that is, with trends running in 45-degree angles and ignores the time axis being a chart-type that is devoid of time.
Time-accurate mode
In Time-accurate mode, the renko bricks move in sync with the current price action above in the time-based chart. This means that the chart moves up or down only when price exceeds the current box size, otherwise, it repeats the last brick forming a horizontal wall at congestion. Each renko brick is formed at the same interval as the current timeframe which is why it is called Time-accurate.
ATR Length
This input defines the length of the ATR function that is used to calculate the optimal box size from the current chart. The default length is 24 bars.
ATR Timeframe
This input sets the timeframe that the calculation for the best box size will be based on. By default, it is set to “Same as chart” which means it will calculate the best box size based on the chart’s current timeframe.
Fixed Box Size
You can assign a static box size when creating a renko chart. You can do this by assigning a value to this input which accepts small numbers like 0.0001 but not below 0. If the input is 0 (which is its default value) then it calculates the best box size based on the ATR inputs above.
Bullish Brick Color
This input defines the color of bullish renko bricks. The default color is green.
Bearish Brick Color
This input defines the color of bearish renko bricks. The default color is red.
Show Box Size
You can use this input to show or hide the label that displays the current box size of the renko chart. This is found at the right side of the last renko brick. This option is enabled by default.
Show Current Price
You can use this input to show or hide the label that displays the current price of the symbol/instrument. This is also found at the right side of the last renko brick and it is enabled by default.
Style
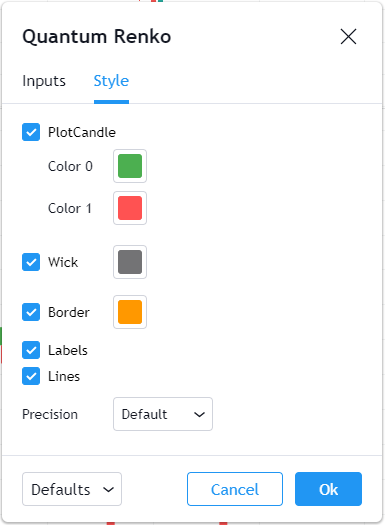
PlotCandle
Changes here only apply when the indicator is in Time-accurate mode. This forms the body (open and close price) of the renko bricks.
- You can hide or display all candlesticks (when Line Chart Mode is disabled) in the index using the checkbox.
- You can customize the color and opacity of the bullish and bearish candlesticks by clicking the color boxes. Color 0 is the color of bullish candlesticks which is blue while Color 1 is the color of bearish candlesticks which is red.
Wick
Changes here only apply when the indicator is in Time-accurate mode. This forms the shadow (high and low price) of the bricks which is not present in this type of renko chart.
Border
Changes here only apply when the indicator is in Time-accurate mode. This is a thin line that wraps the body of the bricks.
- You can hide or show the border of the bricks using the checkbox.
- You can customize the color and opacity of the border by clicking the color boxes.
Labels
This option allows you to show or hide the label objects the indicator creates in the chart. Please always keep this option enabled.
Lines
This option allows you to show or hide the line objects the indicator creates in the chart. Please always keep this option enabled.
Alerts
The Renko indicator has a total of 4 alert conditions.
New Renko Bar
Alert Conditions
- New Renko Bar
Condition
Triggers when a new renko bar is created
Alert message
Example:
- New renko bar created at {open price of the new renko bar}
Bullish Trend Shift
Alert Conditions
- Bullish Trend Shift
Condition
Triggers when a new bullish renko bar is created after a bearish renko bar
Alert message
Example:
- Bullish trend shift detected at {open price of the new bullish renko bar}
Bearish Trend Shift
Alert Conditions
- Bearish Trend Shift
Condition
Triggers when a new bearish renko bar is created after a bullish renko bar
Alert message
Example:
- Bearish trend shift detected at {open price of the new bearish renko bar}
Bullish/Bearish Trend Shift
Alert Conditions
- Trend Shift
Condition
Triggers when a new renko bar is created with an opposite sentiment from the previous renko bar
Alert message
Example:
- Trend shift detected at {open price of the new bullish renko bar}