Quantum Trading Indicators Complete Package for TradingView
$1445 $723
This package includes all the Quantum Trading indicators available for the TradingView platform.
- Quantum Market Strength Indicator (MSI)
- Quantum VRSI Indicator
- Quantum VWAP Pro Indicator
- Quantum Currency Strength Indicator (CSI)
- Quantum Currency Matrix Indicator
- Quantum Currency Array Indicator
- Quantum Currency Heatmap Indicator
- Quantum Cryptocurrency Strength Indicator (CCSI)
- Quantum Radar Panel
- Quantum Renko Indicator
- Quantum Live Camarilla Levels Indicator
- Quantum Trend Monitor Indicator
- Quantum Trends Indicator
- Quantum Tick Volumes Indicator
- Quantum Dynamic Accumulation and Distribution Indicator
- Quantum Dynamic Price Pivots Indicator
- Quantum Dynamic Volatility Indicator
- Quantum Volume Point of Control (VPOC) Indicator
- Quantum USDX Indicator
- Quantum JPYX Indicator
- Quantum EURX Indicator
- Quantum GBPX Indicator
Quantum Trading Indicators VPA Essentials for TradingView
$924 $462
This package includes all the essential Quantum Trading indicators for trading stocks, ETFs, futures, and other markets in the TradingView platform.
- Quantum Market Strength Indicator (MSI)
- Quantum VRSI (Volume Relative Strength Index) Indicator
- Quantum VWAP (Volume-weighted Average Price) Pro Indicator
- Quantum Tick Volumes Indicator
- Quantum Dynamic Accumulation and Distribution Indicator
- Quantum Dynamic Price Pivots Indicator
- Quantum Dynamic Volatility Indicator
- Quantum Live Camarilla Levels Indicator
- Quantum Renko Indicator
- Quantum Trend Monitor Indicator
- Quantum Trends Indicator
- Quantum VPOC (Volume Point of Control) Indicator

Quantum Trading Currency Dashboard for TradingView
$348 $244
The Currency Dashboard is a bundled package of FOUR Quantum Trading indicators for trading forex :
- THE CURRENCY STRENGTH INDICATOR
- THE CURRENCY MATRIX
- THE CURRENCY ARRAY
- THE CURRENCY HEATMAP
This essential package identifies everything you need in order to highlight and identify currency flows and their associated strength and weakness. In a market that is fast moving and complex, the data is delivered quickly and intuitively across the timeframes.
Now with just four indicators, you will be able to monitor every major currency and every one of the 28 currency pairs across all the timeframes, from just one screen. No constant chasing from one window to another, no multiple screens or crammed workspaces. With this unique dashboard of trading indicators you will be able to see instantly every aspect of currency strength and weakness for currencies and currency pairs in all timeframes and at the click of a button. You can of course purchase them individually, but why bother, when you can have all four at such an amazing price!
So why not grab all four now and start trading with confidence based on the knowledge delivered from your very own currency dashboard.
Radar Panel Indicator
$382 $267
One of the biggest issues trading any market is in keeping track of trading opportunities as they arise across all the various timeframes without having multiple monitors or charts open and this is where the Radar Panel steps in. Using TradingView’s Table function, we have incorporated a host of our leading indicators on the panel which can be applied to any timeframe and from which you can instantly spot opportunities as they arise whether in terms of trend, reversals, volatility, or volume. In addition, when using a scanner such as this, it also highlights broad sentiment if, for example, you have added currency pairs from the same matrix or a group of stocks from the same sector. And you can of course have multiples open across the various timeframes.
This package includes the following indicators:
- Quantum Radar Panel (full version)
- Quantum Tick Volumes
- Quantum Dynamic Price Pivots
- Quantum Dynamic Volatility
- Quantum Trends
- Quantum Trend Monitor
- Quantum Live Camarilla Levels
Market Strength Indicator (MSI)
$97
The Market Strength Indicator (MSI) is yet another in our stable of volume-based indicators, and as such, is a must-have tool for trading virtually any type of market and across a myriad of applications from trend trading to swing trading, scalping, and much more. While its sister indicator, the Currency Strength Indicator (CSI), helps you analyze which currencies are oversold, overbought, correlating, and trending, the MSI or Market Strength Indicator does this also, but in this case, for all markets, including stocks, ETFs, futures, and cryptocurrencies, but with one key difference – VOLUME.
Volume Relative Strength Index (VRSI) Indicator
$97
The VRSI indicator is another in the suite of volume indicators we have developed and one that complements our volume price analysis methodology perfectly. and was developed out of a desire to build further on our cornerstone of VPA by peeling back the layers of volume and considering the relative aspect of volume. Hence, the acronym of Volume Relative Strength Index indicator encapsulates what the indicator is all about.
Volume-Weighted Average Price (VWAP) Pro Indicator
$97
At Quantum Trading, we don’t just build a single indicator and leave it at that! We always take them to another level, and here we have done the same, bundling together a total of five indicators into one amazing value package so you can select your favorite from those on offer. The reason for this is we recognize the different ways the volume-weighted average price VWAP is used, which is why we offer a total of FIVE variants to choose from, and these are as follows:
- VWAP – Volume Weighted Average Price
- MVWAP – Moving Volume Weighted Average Price
- AVWAP – Anchored Volume Weighted Average Price
- TWAP – Time Weighted Average Price
- Interday Volume Weighted Average Price
Currency Strength Indicator (CSI)
$97
Ever wondered how some forex traders just make it look so simple? They seem to have a sixth sense of when the market is about to reverse. Yet when you trade, it’s always a struggle?
Well, wonder no more. Chances are, they’re using a Currency Strength Indicator.
The Quantum Currency Strength Indicator shows you instantly, whether a currency is strong or weak. Currencies reverse from strong to weak and back again, all the time. It is these turning points which offer the most profitable trading opportunities. Spotting them can be hard, but not with the Quantum Currency Strength Indicator!!
The Quantum Currency Strength Indicator, makes it simple, showing you precisely whether a currency is strong or weak in all timeframes. From there, it’s easy. Choose your currency pair, and trade with confidence. No more guesswork. No more uncertainty. No more doubt. Invest in yours now, and join that elite group of forex traders with their own crystal ball.
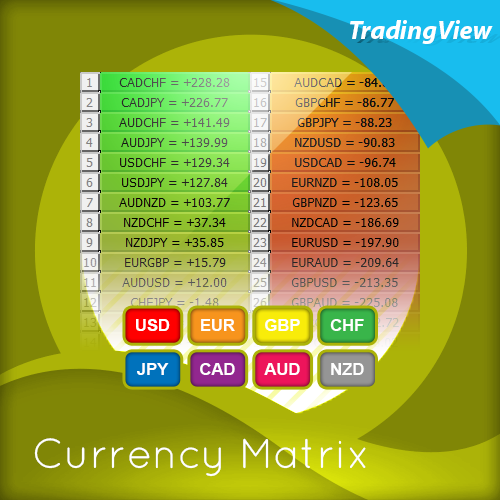
Currency Matrix Indicator
$97
The Quantum currency matrix is a powerful solution to a complex problem. First, it shows you instantly and clearly the strength of the buying or selling in the 28 currency pairs – in real time. Second, with a single click whether this is reflected across the related pairs. Third, whether this applies to both the base and counter currency of the currency pair you are considering. If it is, then the risk on the trade is low, and away you go. Reading the matrix is child’s play. Buying the Quantum currency matrix is even easier – just click the button below, and start trading based on a complete view of every currency pair.

Currency Array Indicator
$97
Imagine what it would be like to monitor the performance of all twenty eight currency pairs on one chart. To see instantly which pairs are trending, and if so how strongly. Which are in congestion, and which in a currency complex such as the euro, are diverging from market sentiment. Well imagine no more. The Quantum Currency Array indicator is here and delivers in spades.
It is a powerful and elegant solution to a complex problem. Now in one single indicator you can see which currency pairs are trending strongly, the momentum of this trend, those which are in congestion, and those pairs approaching an overbought or an oversold state.
The pairs are ranked in a table of strength and dynamically color coded for intuitive analysis. Each pair is then displayed as a single line, with the gradient describing the momentum of the trend. In other words the strength of the move. To help further, the indicator then signals those currency pairs approaching an overbought or oversold condition in the ranking table.
And in addition the Currency Array gives you an instant warning of whether the currency you are focusing on is being bought or sold universally. In other words, a heads up to risk.
And last but not least, you can check all twenty eight pairs across all the timeframes within seconds. No more missed opportunities. No need to have hundreds of charts or multiple screens. It is all here. Compact, elegant, instant and clear. The complex sea of forex sentiment that ebbs and flows second by second, all beautifully displayed on one chart.
So why not add the Quantum Currency Array to your trading tools today, and navigate your way smoothly through your forex trading day.
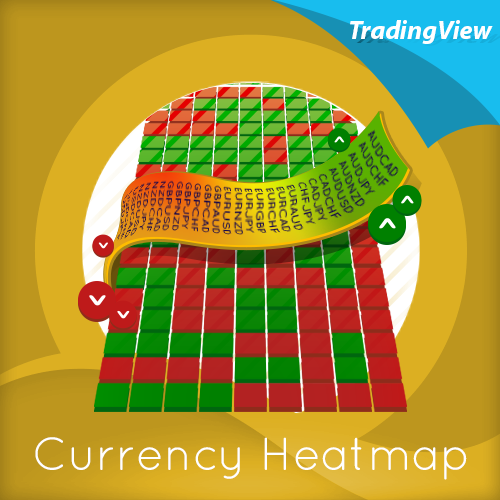
Currency Heatmap Indicator
$57
The Quantum Currency Heatmap delivers the complex information you need as a forex trader - FAST. In fact so fast it displays a total of 140 chart snapshots, on one screen. That's twenty eight currency pairs in 5 ADJUSTABLE timeframes - almost impossible to imagine if displayed in a conventional way. Now, thanks to the Quantum Currency Heatmap, seeing and interpreting this much trading data has never been so easy! No need for multiple monitors, multiple PC's, crowded screens, or chasing price movement from one timeframe to another and back again.
The Quantum Currency Heatmap does this by systematically displaying the "hottest" and "coldest" areas of the forex landscape using an intutive color coding scheme. It's like a thermal imagery scanner, but for forex! Much like its sister indicator, the Quantum Currency Matrix, it assigns a rank to each of the 28 currency pairs, but from data crunched across the time horizon. Currency pairs are then ranked vertically and horizontally to describe strength and weakness in two dimensions. The ultimate heatmap of bullish and bearish sentiment in all timeframes, and at the click of a button.
So what are you waiting for? Grab yourself a Quantum Currency Heatmap and jump into the hottest trading opportunities, as they develop in real time.
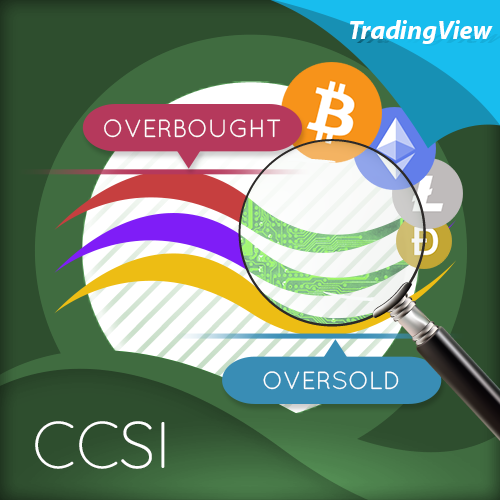
Cryptocurrency Strength Indicator (CCSI)
$97
The Cryptocurrency Strength Indicator (CCSI) has been developed with one objective in mind. To give you a clear and unequivocal view of where each cryptocurrency on the TradingView platform is heading in all time-frames, quickly and easily. Each cryptocurrency is described in a graphical way with a solid coloured line which reveals instantly whether that particular cryptocurrency is overbought or oversold, and the strength of any trend. All are based against USDT which is the counter cryptocurrency and shown separately, and which is invaluable in any analysis as this provides the opposing force to drive the cryptocurrency higher or lower with momentum. If the cryptocurrency is rising strongly and the USDT is falling with similar strength, then a strong trend higher will be in progress. Equally if the cryptocurrency is falling strongly and the USDT rising, a strong trend lower will be in progress.
The Cryptocurrency Strength Indicator works in all time-frames available on the TradingView platform, but as with all our indicators we strongly recommend using them across multiple time-frames for trading.
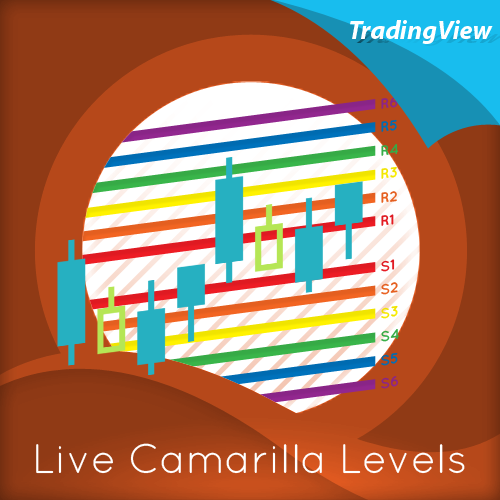
Live Camarilla Levels Indicator
$57
The Live Camarilla Levels indicator works in all timeframes on both standard and custom charts, and in every market, so can be used to trade stocks, commodities, forex or indices.
So whether you’re a discretionary trader who prefers swing and trend trading, or a breakout trader who is perhaps more systematic, the Camarilla levels indicator can deliver it all. And to help you when using the indicator we’ve also included some simple messages to guide you as the various levels are approached and tested, including those all important levels for stop loss placement.
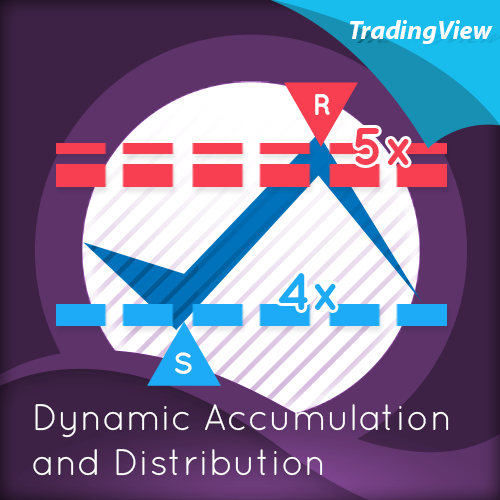
Dynamic Accumulation and Distribution Indicator
$97
Another dynamic indicator that works in real time. Are you getting the picture? Trading success is all about taking and making decisions at the live edge of the market - that's why we call them dynamic. If you are one of those traders, endlessly drawing lines on your charts, and confusing yourself. Stop right now.
Support and resistance is one of the most powerful concepts for the technical trader. These price regions are where the institutions buy and sell, creating these natural levels. It is here, that prices pause, and often reverse, giving two benefits in one. First, a great place to get in, and secondly even more importantly, a place to close out, and take profits off the table!
Now at last, you have a tool to do all the hard work for you - dynamically. Just apply the indicator, and sit back. Put away your drawing tools forever, and let the Quantum Dynamic Accumulation and Distribution indicator do all the hard work for you! Not only does it work dynamically in real time, it also displays the depth of these regions, the number of times they have been hit, and from which direction, giving you something unique - the complete picture of sentiment and depth at each and every level. So what are you waiting for?
Volume Point of Control (VPOC) Indicator
$97
Most technical indicators uncover and exploit the patterns price etch on the charts and make assumptions, suggestions, and predictions of the next price action. However as you can see clearly, price is only half the story. The measure of activity behind price action is key. As a pure technical analysis tool, Quantum Volume Point of Control (VPOC) indicator is mathematical proof that volume is an important factor in determining price action.

Trends Indicator
$97
All traders know that price is a leading indicator. Yet few traders ever discover how to correctly interpret the start of a new trend, or indeed the end of an old one. To add further complexity, markets spend over 70% of their time in congestion, moving sideways in a narrow range. The traders worst enemy.
What's the answer? Step forward - the Quantum Trends indicator. With this simple and elegant indicator, dynamic trends are painted for you instantly and dynamically, in real time. In trading any market, you need to be quick on your feet, and the Quantum Trends indicator delivers in spades! But even better, not only will it signal your possible entry and exit, it also signals a market in congestion - equally important. Knowing when to stay out, is just as important as knowing when to get in.
Grab your copy of the Quantum Trends indicator now - and bring your charts, and your trading to life.
Trend Monitor Indicator
$97
One of the hardest things to do in trading is to stay in and take the maximum you can from any position. You know how it goes. You get in and all is going well. Then the market reverses. You get frightened and close out. What happens next?
Yes, you guessed it - the market reverses again and starts to move fast. Now it's too late. You have missed out on some great profits, and are left wishing you had stayed in.
That's why we developed the Quantum Trend Monitor. It does just that. It monitors the strength of the trend. It will help you stay in when your emotion is telling you to get out. The Trend Monitor will give you the confidence to continue to hold the position, when your emotions may be telling you to do something else! So..... get it now - and banish trader regret forever with the Quantum Trend Monitor.
Tick Volumes Indicator
$37
Volume is another powerful leading indicator. Yet few forex traders ever take advantage of its awesome power. Why? Because identifying volume trends using the standard indicator can be confusing, and judging volume height even more so!
The Quantum Tick Volumes indicator takes a simple tool and makes it come to life! First, it paints the volume bar to match the candle. This makes it quick and easy to identify buying and selling volume with the associated price action.
Second, the Quantum Tick Volume indicator displays a dynamic mid point, instantly telling you whether volumes are high, average or low in the session. No more guesswork! Volume analysis made simple!
Renko Indicator
$57
Harness the power of Renko charts with the Quantum Renko indicator which now comes in Standard Mode and the all new Time-accurate Mode that lets you synchronize your Renko chart with the current timeframe. The Quantum Renko indicator works 100% with any TradingView account type - yes, even non-pro accounts! Get yours now!
Dynamic Price Pivots Indicator
$57
The Quantum Dynamic Price Pivots indicator, could best be described as the Swiss army knife of trading. Power, simplicity and functionality all in one tool. Many traders struggle to identify reversal points based on price action alone. Why? Because you need to have a complete understanding of candlesticks, candles and candle patterns. Well struggle no more!
The dynamic pivot appears once a three candle price pattern is created. This is one of the first signs of a possible change in sentiment, based on the price action alone. A pivot high in an up trend, and pivot low in a down trend. So whether you are trading long or short, the Quantum Dynamic Price Pivots indicator will instantly give you a visual signal to - pay attention! Powerful, yet so simple, and two indicators in one!
Dynamic Volatility Indicator
$79
Volatility can be both good and bad. Great for making money fast. Not so good when you're on the losing side! But how do you know when a market is volatile. Is the price action you are seeing normal for that currency pair? And more importantly, what is normal?
The Quantum Dynamic Volatility indicator is designed with one objective in mind. To show you, dynamically volatile price action. You then decide, based on the price action, whether to wait, or take advantage. One of the hardest things to learn in trading, is when to stay out. The Quantum Dynamic Volatility indicator makes this child's play - keep you safe. It could almost be called your safety belt!
US Dollar Currency Index Indicator
$19
The Quantum USDX gives a more balanced view of the US Dollar, using four equally weighted currencies to calculate an index more relevant in today’s world. Whatever the market or instrument you trade, having a view on the US Dollar is fundamental to your success as a trader.
Japanese Yen Currency Index Indicator
$19
Forecasting the direction of the Japanese Yen has never been easy – until now! The Quantum JPYX indicator does just that – and all inside your TradingView platform. Add one to your Yen currency chart today and start trading the JPY pairs with confidence.
Euro Currency Index Indicator
$19
The Euro is the third of our trio of influential currencies in the Forex market, and whilst the dollar index has been available for many years, index for the Euro has been hard to find… until now. The Quantum EURX brings it all to you in your own TradingView account providing an instant view of the Euro against a basket of currencies. If you are trading the Euro, either in a major or cross currency pair, this index will help you make sense of the currency and in turn, related pairs. So look no further and invest in one now.
British Pound Currency Index Indicator
$19
Have you been looking for a reliable British Pound currency index to aid you in your technical analysis? Finding one in the wild is certainly difficult, until now… Quantum Trading is proud to introduce its official GBP currency index indicator for the TradingView platform, the Quantum GBPX!
Add this to your TradingView dashboard and start making more meaningful analysis and more informed trading decisions on various GBP currency pairs. Get your very own Quantum GBPX today!

Trend Radar Panel Package
$194 $136
The Trend Radar Panel indicator focuses on tracking trends with Quantum Trading's trend indicator duo.
This package includes the following indicators:
- Quantum Trend Radar Panel
- Quantum Trends
- Quantum Trend Monitor
Basic Radar Panel Package
$188 $132
The Basic Radar Panel features some of Quantum Trading's most popular indicators like Dynamic Price Pivots, Live Camarilla Levels and more.
This package includes the following indicators:
- Quantum Basic Radar Panel
- Quantum Tick Volumes
- Quantum Dynamic Price Pivots
- Quantum Dynamic Volatility
- Quantum Live Camarilla Levels

Quantum Trading Indicators Forex Package for TradingView
$173 $121
This package includes the Quantum Trading indicators for TradingView that are useful in trading the financial markets:
- Quantum Currency Strength Indicator (CSI)
- Quantum USDX
- Quantum JPYX
- Quantum EURX
- Quantum GBPX
Quantum Trading Indicators Basic Package for TradingView
$479 $335
This package includes some of the most popular indicators of Quantum Trading for the TradingView platform.
- Quantum Currency Strength Indicator (CSI)
- Quantum Dynamic Price Pivots Indicator
- Quantum Dynamic Volatility Indicator
- Quantum Live Camarilla Levels Indicator
- Quantum Tick Volumes Indicator
- Quantum Trends Indicator
- Quantum Trend Monitor Indicator
Quantum Trading Indicators Index Package for TradingView
$76 $53
This package includes all the Quantum Trading currency index indicators.
- Quantum USDX (US Dollar currency index)
- Quantum JPYX (Japanese Yen currency index)
- Quantum EURX (Euro currency index)
- Quantum GBPX (British Pound currency index)
Quantum Trading Indicators Trends Package for TradingView
$194 $136
This package includes the trend indicator duo of Quantum Trading.
- Quantum Trends Indicator
- Quantum Trend Monitor Indicator