Overview
Many forex traders are familiar with the concepts of volume price analysis as enshrined in Wyckoff’s three laws of effort and result, cause and effect and supply and demand. This is the linear relationship between volume and price. Now with the Volume Point of Control, this relationship is taken to the next level adding the concept of time and inspired by the ideas behind market profile.
The Quantum Volume Point of Control, or VPOC indicator blends ALL THREE of these important aspects of trading into a single powerful and visual indicator.
What The VPOC Indicator Will Do For You
The Quantum VPOC indicator takes the analysis of volume and price to a higher level, which both complements and expands the VPA relationship. Whilst the Quantum tick volumes indicator considers the relationship between a single volume bar and its associated candle on the price time x-axis or groups of candles and volume bars, the Quantum VPOC indicator analyses the density and intensity of volume over time against price. In other words, the volume price relationship on the y axis. It does this in three distinct ways as follows:
First
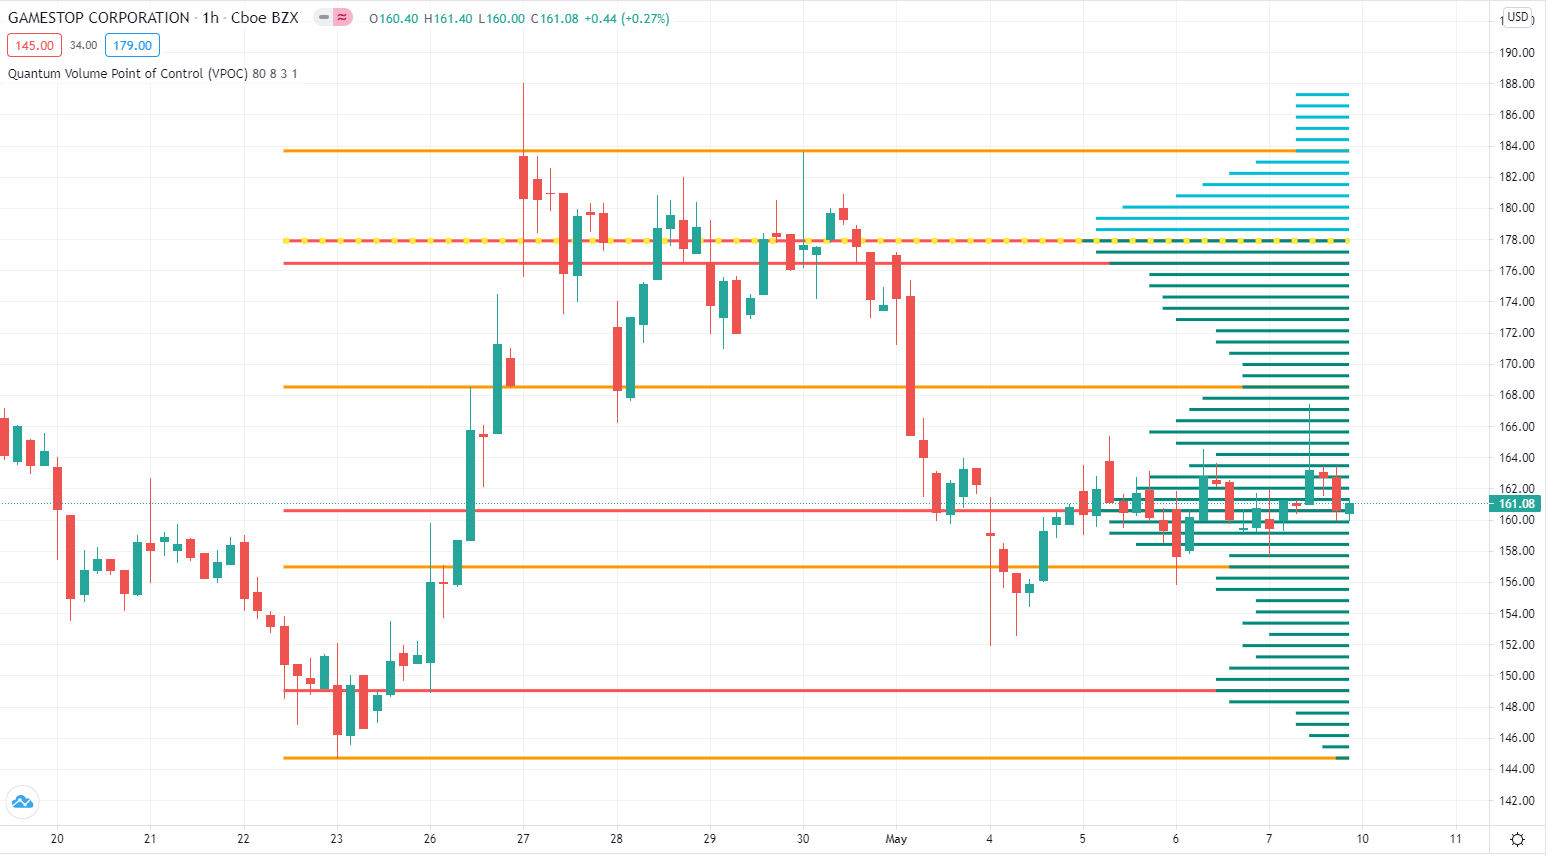
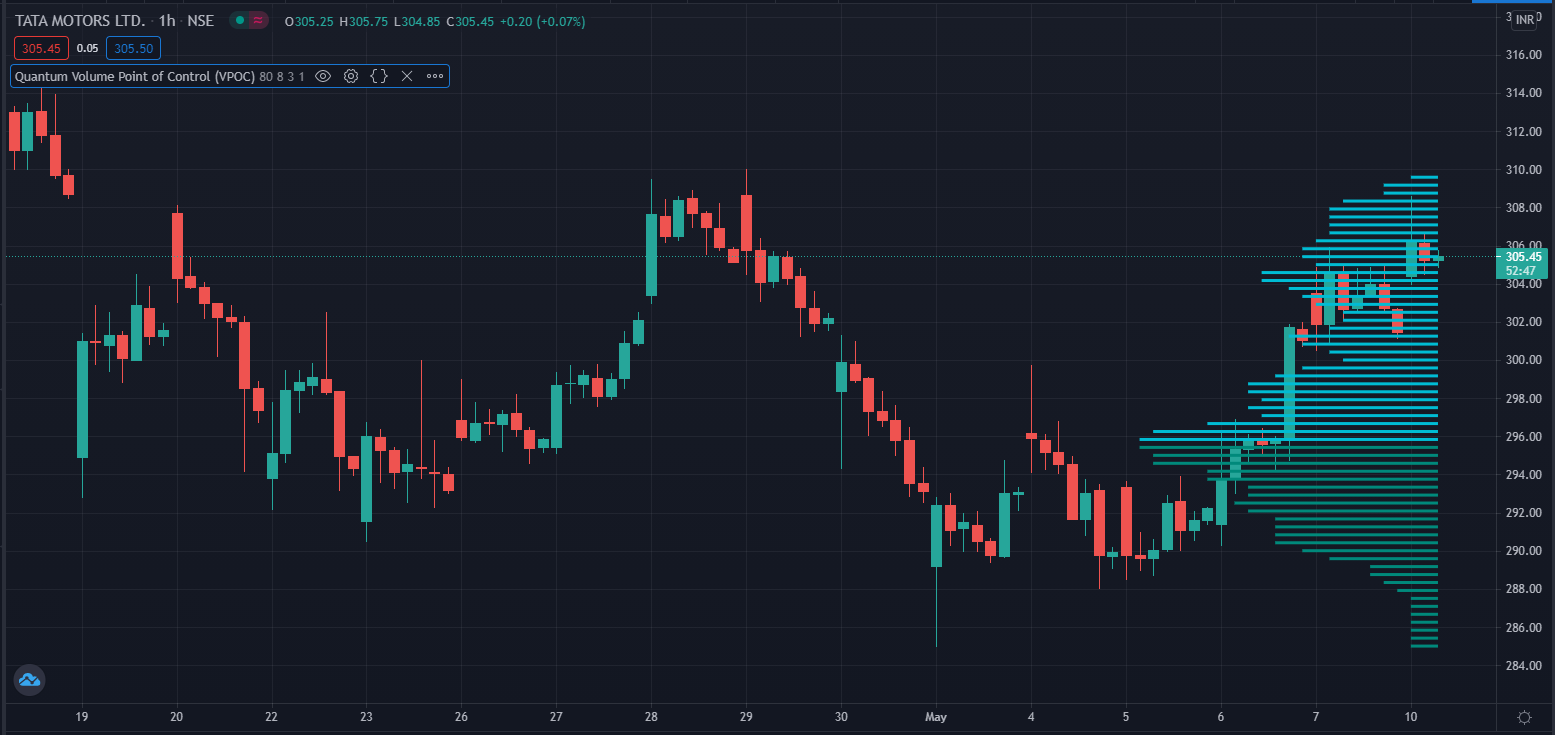
First, the Quantum VPOC indicator constructs the Volume Profile from a set number of bars in history to the most current bar. The Volume Profile is then presented as a vertical histogram shown at the right edge of the chart – a stack of horizontal bars of varying lengths, but of equal height representing the amount of activity at each price level.
Second
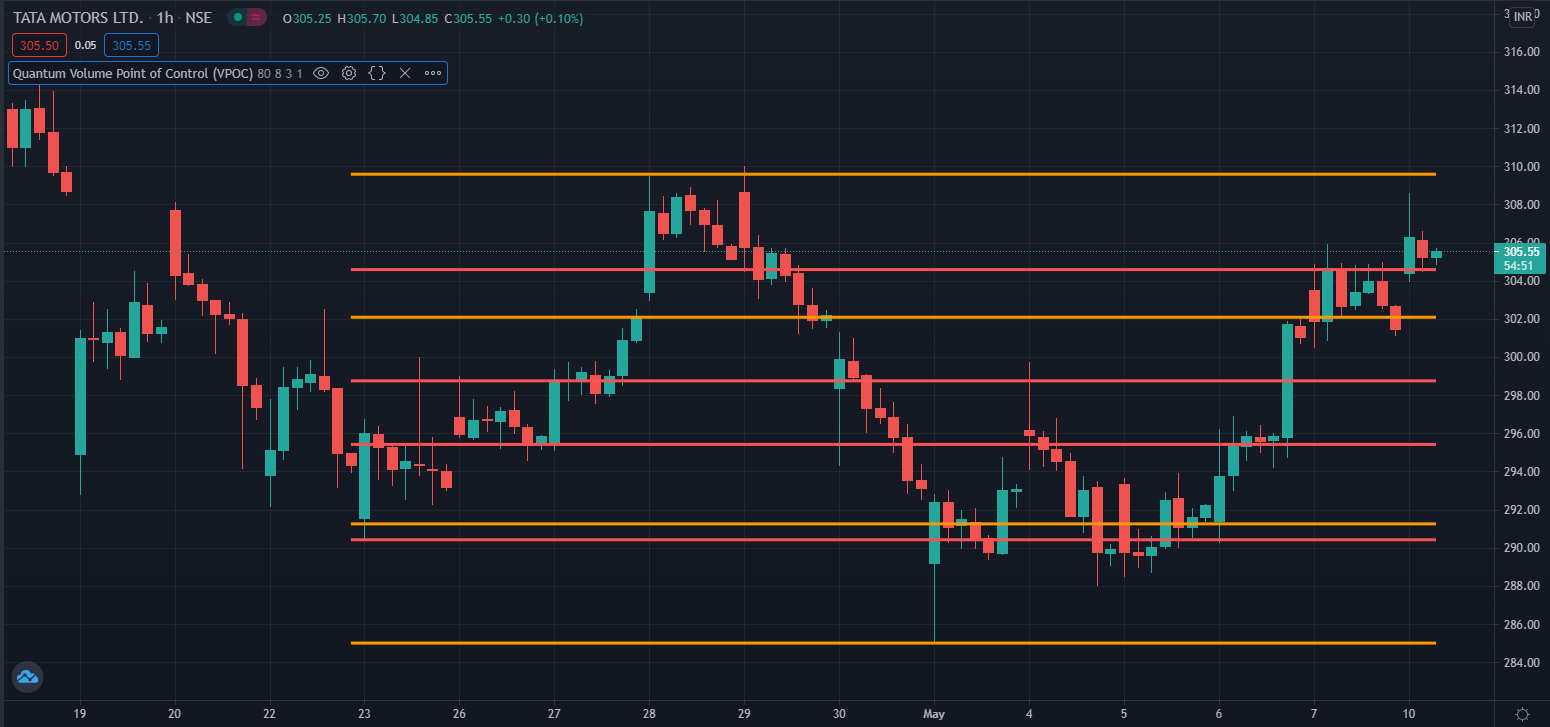
Second, the Quantum VPOC analyzes the Volume Profile to find the key price levels where activity is strong and rising, or weak and falling. In other words, the indicator looks for peaks (long bars) of the Volume Profile where price tends to be attracted as these are areas where price was previously accepted. These are called High Volume Nodes (HVN). The indicator also looks for troughs or valleys (short bars) of the Volume Profile where price tends to be repelled as these are areas where price was previously rejected. These are referred to as Low Volume Nodes (LVN). Both types of price level act as precise zones of support and resistance and as such are projected across the chart within the given period.
Third
Third, the Quantum VPOC indicator looks for the Highest Volume Node or the highest peak in the Volume Profile and marks it as the Volume Point of Control – the price level which acts as the fulcrum from which price pivots. The indicator completes its calculations and updates as each new volume bar is delivered.
The result is a chart revealing the overarching influence of volume at price, coupled with time.
What The VPOC Indicator For TradingView Displays
The Quantum VPOC indicator displays several key pieces of information on the chart as follows:
- Volume Profile – this appears as a histogram of volume on the vertical price axis on the right-hand side of the chart. The peaks and troughs are clearly displayed highlighting both High and Low Volume nodes.
 NODES
NODES - High volume node (HVN) – this is where we have a bulge in the volume profile generally because of an extended phase of price congestion. As a result, as the market approaches these regions on the chart price action is likely to become waterlogged with further congestion likely with the node acting as a strong area of support or resistance. As we have seen a strong acceptance of price at this level in the past, this is likely to be repeated with the market swinging in a range. Ultimately the market may reverse off these levels, with any move through then confirming the current sentiment.
- Low volume node (LVN) – this is where we see low volume in the volume profile. In these regions, the market has only paused temporarily – in other words a region where price has been rejected in the past. As such we are likely to see the market move quickly through these regions with little in the way of resistance or support acting to prevent a further advance of decline in price. The current sentiment is likely to continue and build quickly through these levels.
Support And Resistance Zones
- Support and Resistance Zones – these are drawn at the High and Low Volume nodes to highlight the various HVN and LVN levels on the price axis.
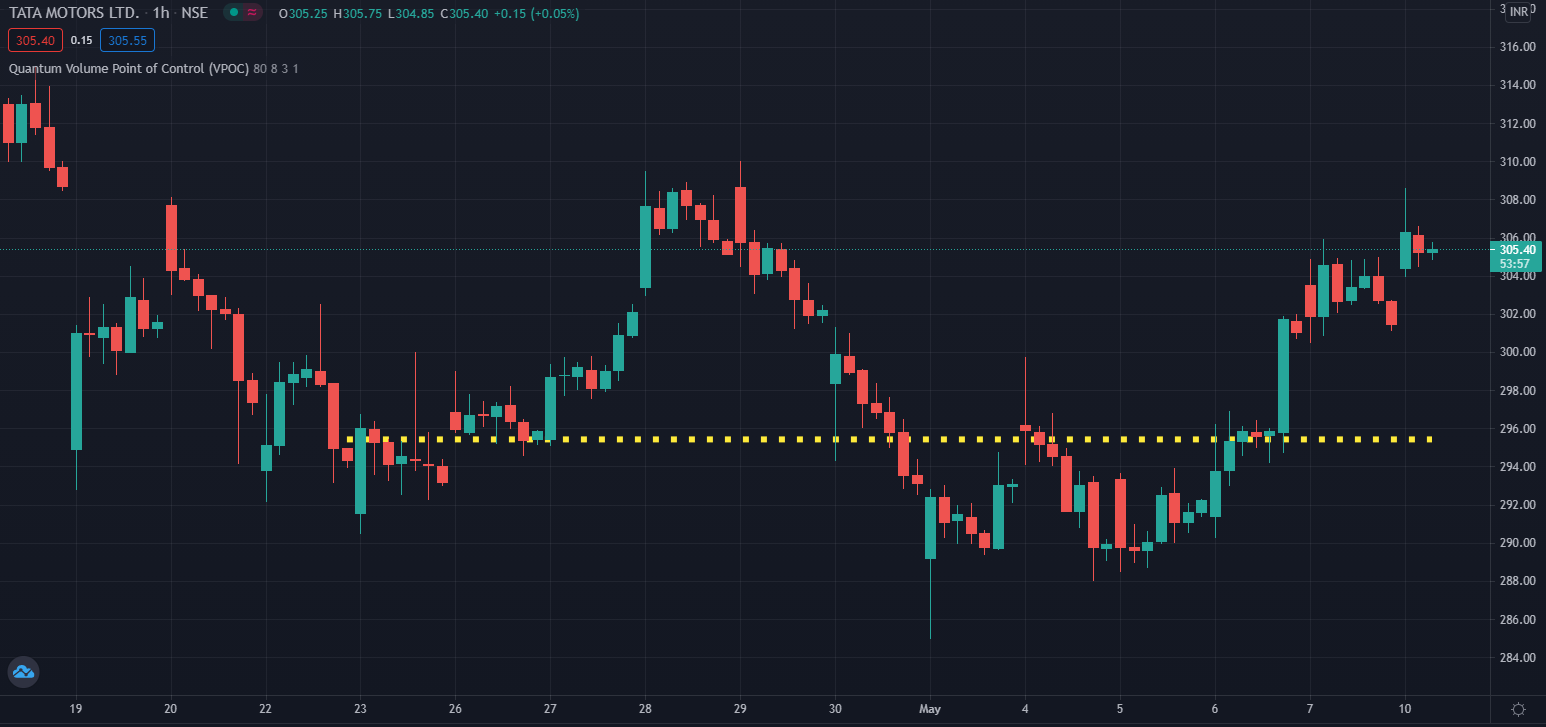
- Volume Point of Control Line – this is drawn as a single line on the highest volume of the High Volume Node in the timeframe and clearly defines the tipping point of sentiment. This moves dynamically and represents the fulcrum of market sentiment where price has reached agreement, before moving on. If it is above the price action, then the current market sentiment is bearish. If it is below the current price action, then the current market sentiment is bullish. The VPOC Line reveals this balance simply, quickly, and clearly allowing you to judge market sentiment with accuracy and confidence.
As with all the Quantum Trading indicators, the VPOC indicator is dynamic, constantly changing and updating to reflect the relentless shift in sentiment as the market moves from bullish to bearish and back again. The indicator works in all timeframes and provides a powerful and much deeper understanding of support and resistance through the prism of volume and the associated High and Low Volume Nodes, with the Point of Control itself, acting as the fulcrum of the market.
Settings
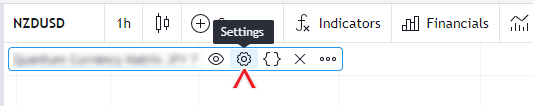
The Settings button appears as a small cog/gear icon beside the name of the indicator at the chart. Clicking the button shows a dialog box for configuring the Inputs and Style options.
Inputs
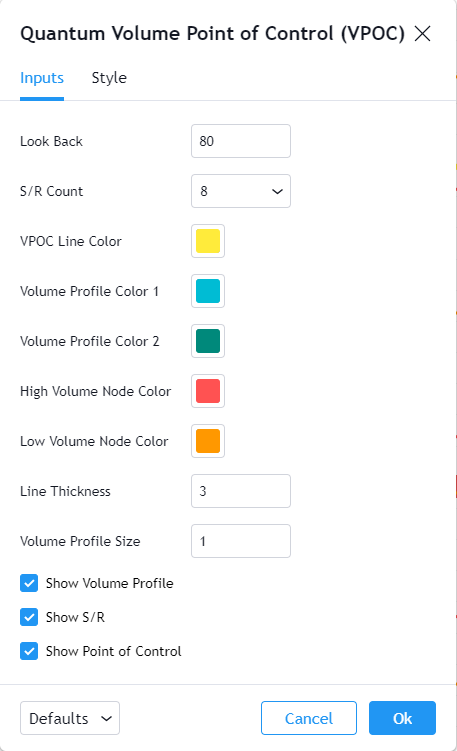
Look Back
This input defines the scope of the indicator. The objects generated by the indicator such as the support and resistance zones, volume point of control, and the volume profile will cover bars up to the value of this input. For example, if the Look Back is set to the default value which is 80 bars then the indicator will calculate the volume profile from the 80th bar in the chart to the most current one. The support and resistance zones as well as the volume point of control will be projected to the 80th bar in history.
S/R Count
This input allows you to choose the number of support and resistance lines or the HVN and LVN areas analyzed by the indicator from the volume profile. You can choose from 4, 6, 8, 10, and 12 S/R lines and the default number is 8.
VPOC Line Color
This input defines the color of the VPOC Line which is set to yellow by default.
Volume Profile Color 1
This input defines the color of the volume profile’s upper half (above the VPOC line).
Volume Profile Color 2
This input defines the color of the volume profile’s lower half (below the VPOC line).
High Volume Node Color
This input defines the color of the high volume node S/R lines.
Low Volume Node Color
This input defines the color of the low volume node S/R lines.
Line Thickness
This input allows you to increase or decrease the thickness of the indicator’s line objects which comprise of the volume profile, VPOC line and S/R lines.
Volume Profile Size
This input allows you to scale up the size of the volume profile.
Show Volume Profile
You can use this input to show or hide the volume profile.
Show S/R
You can use this input to show or hide the HVN and LVN lines.
Show Point of Control
You can use this input to show or hide the VPOC line.
Style
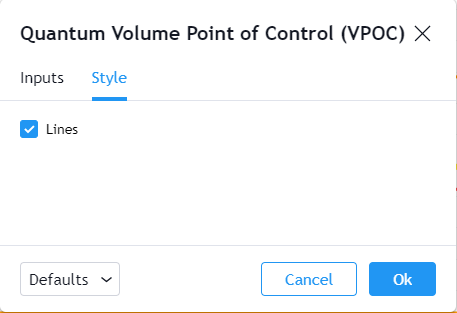
Lines
This option shows/hides the line objects used by the indicator. Please do not disable this option.
Alerts
The Volume Point of Control (VPOC) indicator has a total of 3 alert conditions.
Point of Control
Alert Conditions
- Cross Point of Control
Condition
Triggers when the current price crosses the point of control line
Alert message
Example:
- Point of control crossed at {current close price}
High Volume Node
Alert Conditions
- Cross High Volume Node
Condition
Triggers when the current price crosses one of the high volume node price levels
Alert message
Example:
- A high volume node was crossed at {current close price}
Low Volume Node
Alert Conditions
- Cross Low Volume Node
Condition
Triggers when the current price crosses one of the low volume node price levels
Alert message
Example:
- A low volume node was crossed at {current close price}