Overview
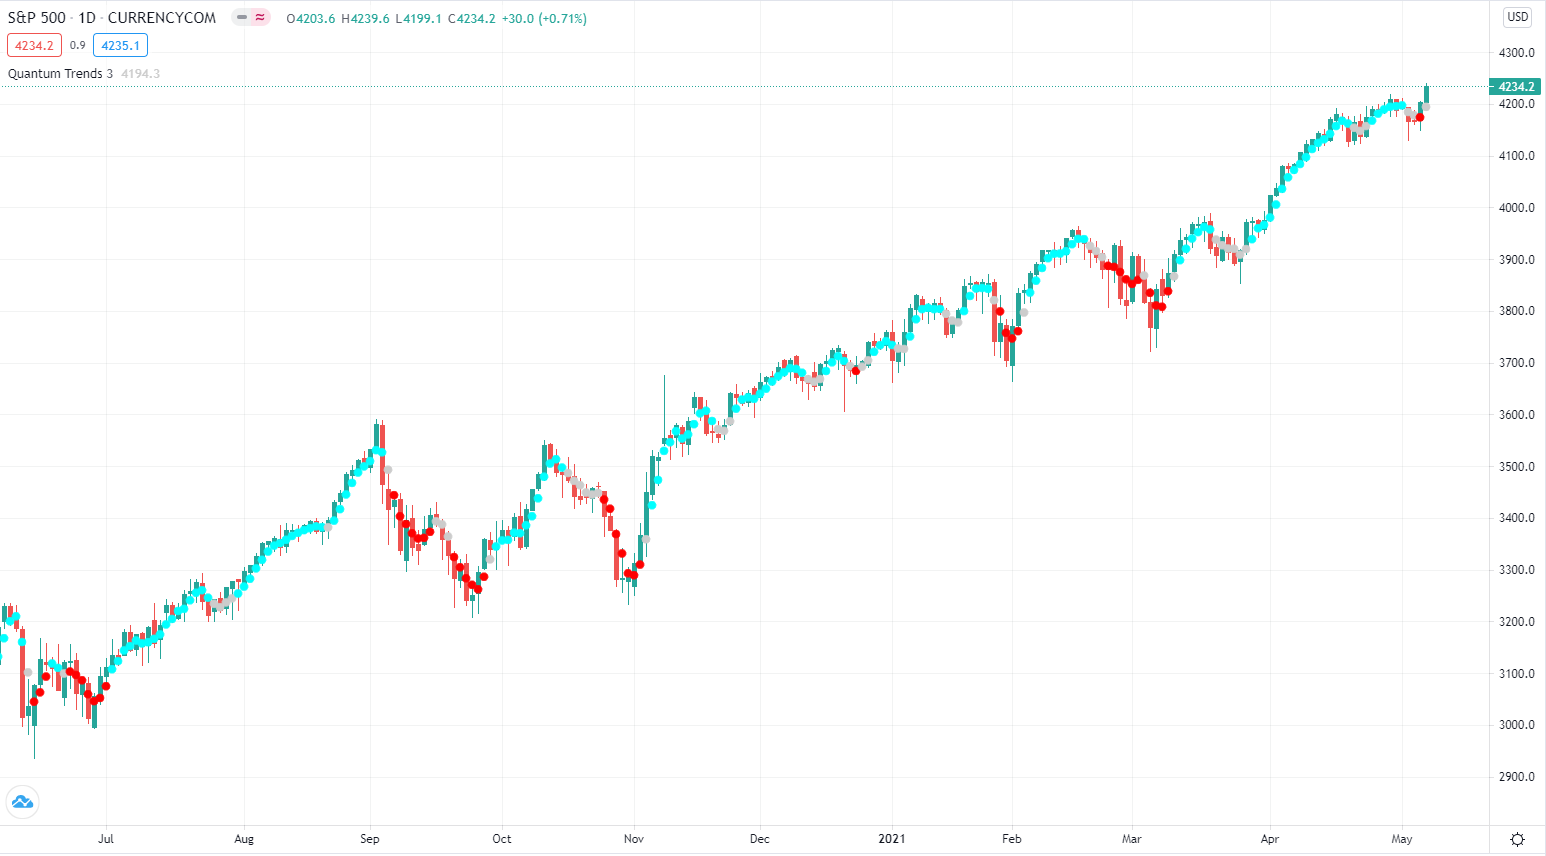
The Quantum Trends indicator is a ‘sister’ indicator to the Quantum Trend Monitor, and work together hand in hand, to keep you in and surfing the trend. This indicator has been designed to be a leading indicator of trend and is therefore extremely sensitive to the minor reversals and pullbacks which occur in all trends. This is where the Trend Monitor becomes so powerful, keeping you in for the longer term. The Trends indicator has also been designed to show you simply and clearly when a trend is potentially starting, ending, or simply moving into a minor congestion phase. All this is achieved with the trend dots, which change color accordingly.
As with all the Quantum trading indicators, the Quantum Trends is best used in multiple timeframes which will give you visual signals to changes in trend, both upstream and downstream of your principal trading chart.
- The Quantum Trends indicator works in all timeframes from seconds to minutes and months.
- The indicator can be ‘fine-tuned’ to your own preferences in terms of the speed with which the indicator will react to possible changes in trend.
Settings
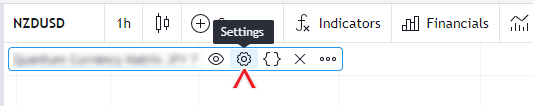
The Settings button appears as a small cog/gear icon beside the name of the indicator at the chart. Clicking the button shows a dialog box for configuring the Inputs and Style options.
Inputs
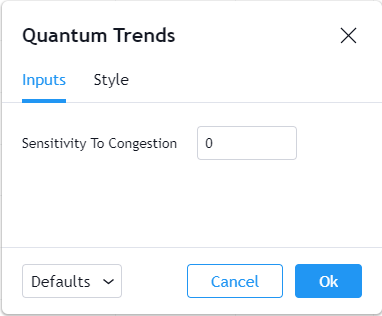
Sensitivity to Congestion
This user input has been provided to allow you to fine-tune the indicator to your own trading style and attitude to risk. Increasing its value makes the indicator more sensitive to detecting congestion phases of price action. This means you will see more of the grey dots which are early signs of potential weakness in the respective trends.
This is a personal choice, and a user input we have included to allow you to have control over the indicator, and whether you want to be alerted earlier to potential weakness or pauses in the trend or are happy to wait before such changes are signaled slightly later, and over shorter periods on the indicator. This is your choice and so can be configured to your own trading style and attitude to risk.
Style
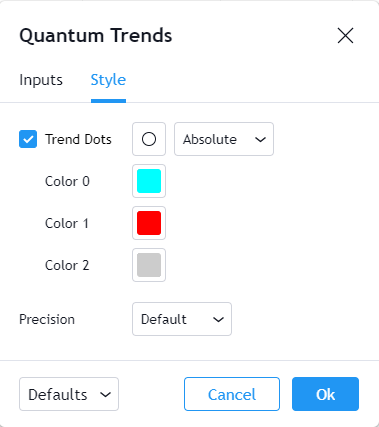
Trend Dots
This is a smoothed dotted line that changes color indicating the strength of short-term trends.
- You can hide or display the Trend Dots plot using the checkbox.
- The first box allows you to change the dots to another character from a list of options.
- The second box allows you to change the position of the dots in the candlesticks. We do not recommend changing this setting and please keep its value at “Absolute”.
- You can customize the colors, opacity, and thickness of this plot by clicking the color boxes. The first color box represents the bullish trend dots. The second color box represents bearish trend dots. The third color box represents congestion/ranging trend dots. The default colors of these dots are cyan, red and gray respectively.
Precision
This determines the number of decimal places the indicator uses to display the current value of its plots. You can adjust this by choosing from a drop-down list.
Alerts
The Trends indicator has a total of 3 alert conditions.
Trend Change
Alert Conditions
- Uptrend
- Downtrend
- Congestion
Condition
Triggers when the trend change is detected
Alert message
Examples:
The following alert messages are used respectively with the corresponding Alert Conditions above
- Uptrending at {price level of the current trend dot}
- Downtrending at {price level of the current trend dot}
- Congested/Ranging at {price level of the current trend dot}