Overview
Staying in any trend to maximise your profits, is the hardest thing to do in trading, without question which is why we developed the Quantum Trend Monitor indicator, to help you do just that.
The Quantum Trend Monitor is in fact two indicators in one. It’s been designed to help you stay in trends once they begin, but also to signal when a trend is potentially coming to an end or is simply pausing before continuing further. The indicator is best used in conjunction with the Quantum Trends Indicator. The Trend Monitor aims to smooth out the minor pullbacks and reversals which are all part and parcel of the price action, helping to keep you in the trend to maximise the profit potential from every position.
What The Trend Monitor Will Do For You
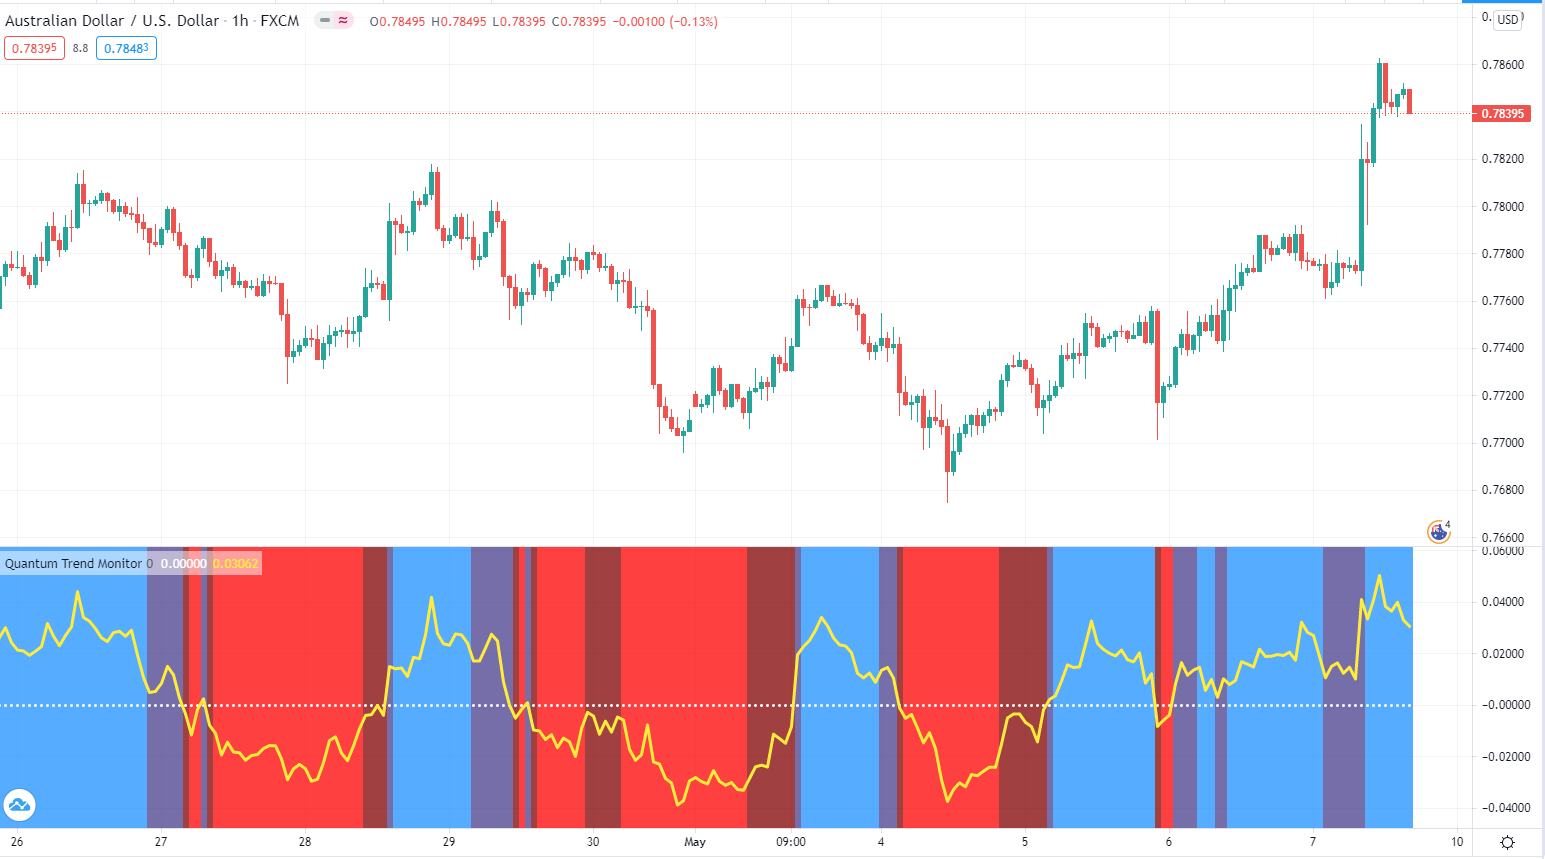
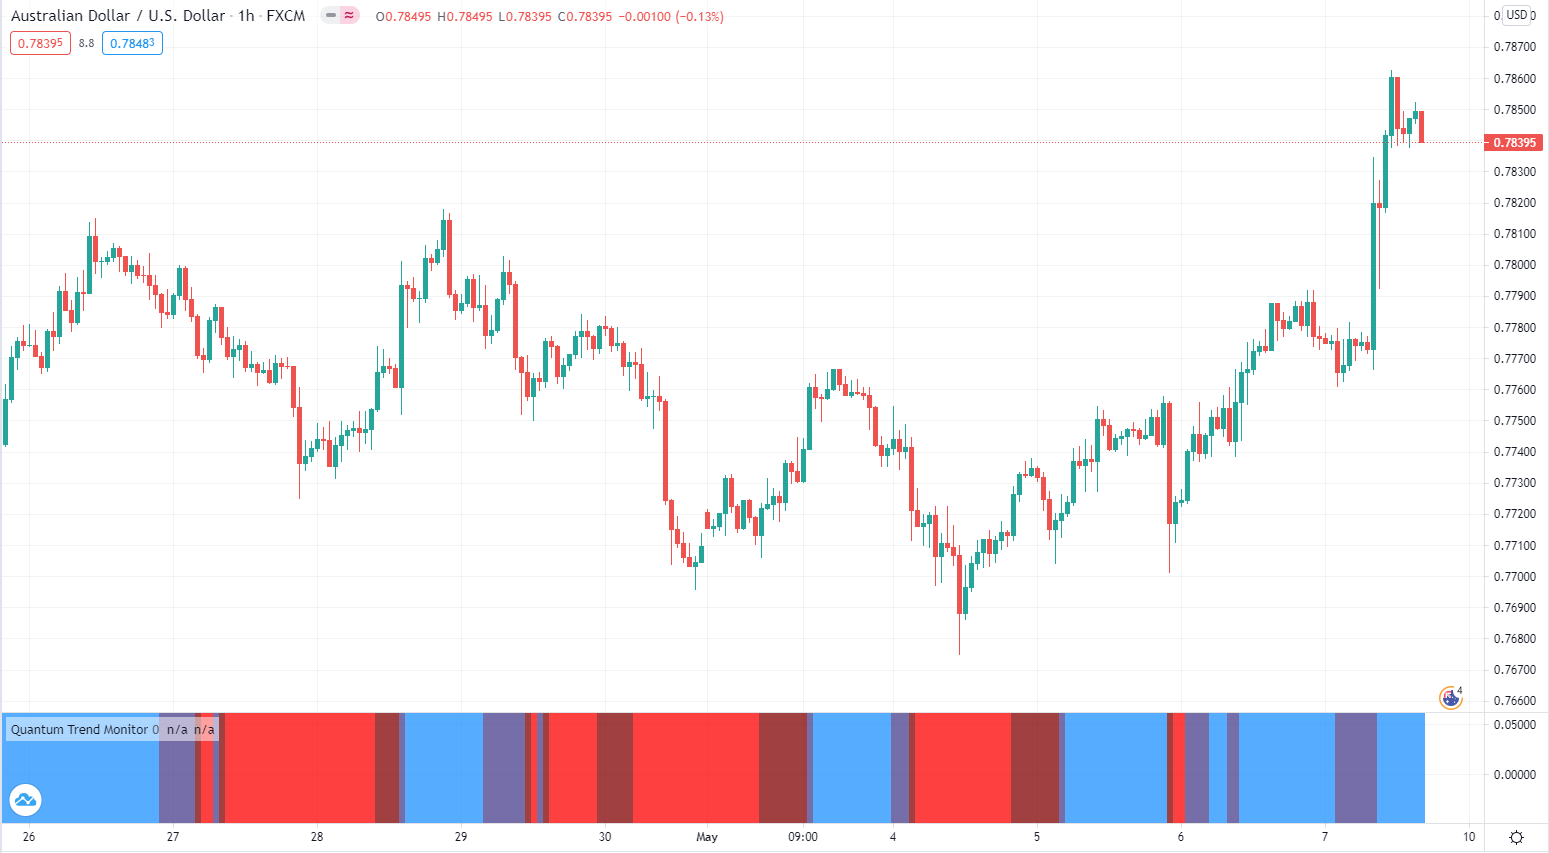
This is a function of the solid bar, which displays four colours. When the market is trending strongly, the Trend Monitor is either bright red or bright blue. When the market is in transition or at a pause point, the Trend Monitor is either dark red or dark blue. If the Trend Monitor transitions from one bright color to another, (from red to blue, or form blue to red) this is signaling the current trend has potentially come to an end. The Trend Monitor smooths out the ups and downs in a trend, which will be reflected in your Quantum Trends, which then provides the ‘fine detail’ of every move.
But there’s more….
The second element of the Trend Monitor is the yellow trend line, which displays the ‘strength’ of the trend, and gives an additional perspective on the trend itself. The trend line moves above and below the ‘mean’ which is displayed as a white dotted line on the indicator. As the trend develops, so the yellow trend line moves above and below the mean level, and as it reaches the extremes, this is another potential signal the trend is becoming exhausted.
The trend line indicator can be applied directly on the Quantum Trend Monitor itself, as shown above to keep your charts clean and clear, or separately in another window. As with all the Quantum trading indicators, the Quantum Trend Monitor is best used in multiple timeframes which will give you visual signals to changes in trend, both upstream and downstream of your principal trading chart.
- The Quantum Trend Monitor indicator works in all timeframes.
- The indicator can be ‘fine-tuned’ to your own preferences in terms of the speed with which the indicator will react to possible changes in trend.
- For clarity, we find it is best applied to the bottom of the chart.
Settings
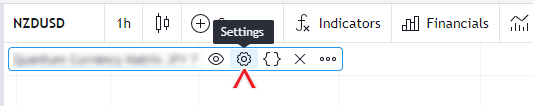
The Settings button appears as a small cog/gear icon beside the name of the indicator at the chart. Clicking the button shows a dialog box for configuring the Inputs and Style options.
Inputs
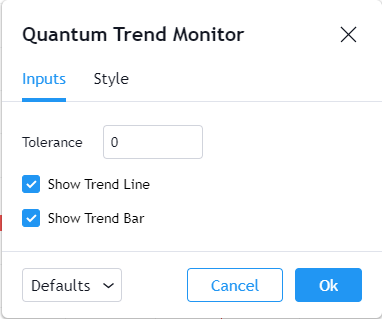
Tolerance
This input is a factor used by the indicator to smooth out the noise in the chart’s price action. As you increase its value, easing in and out of stronger trends become more apparent.
Show Trend Line
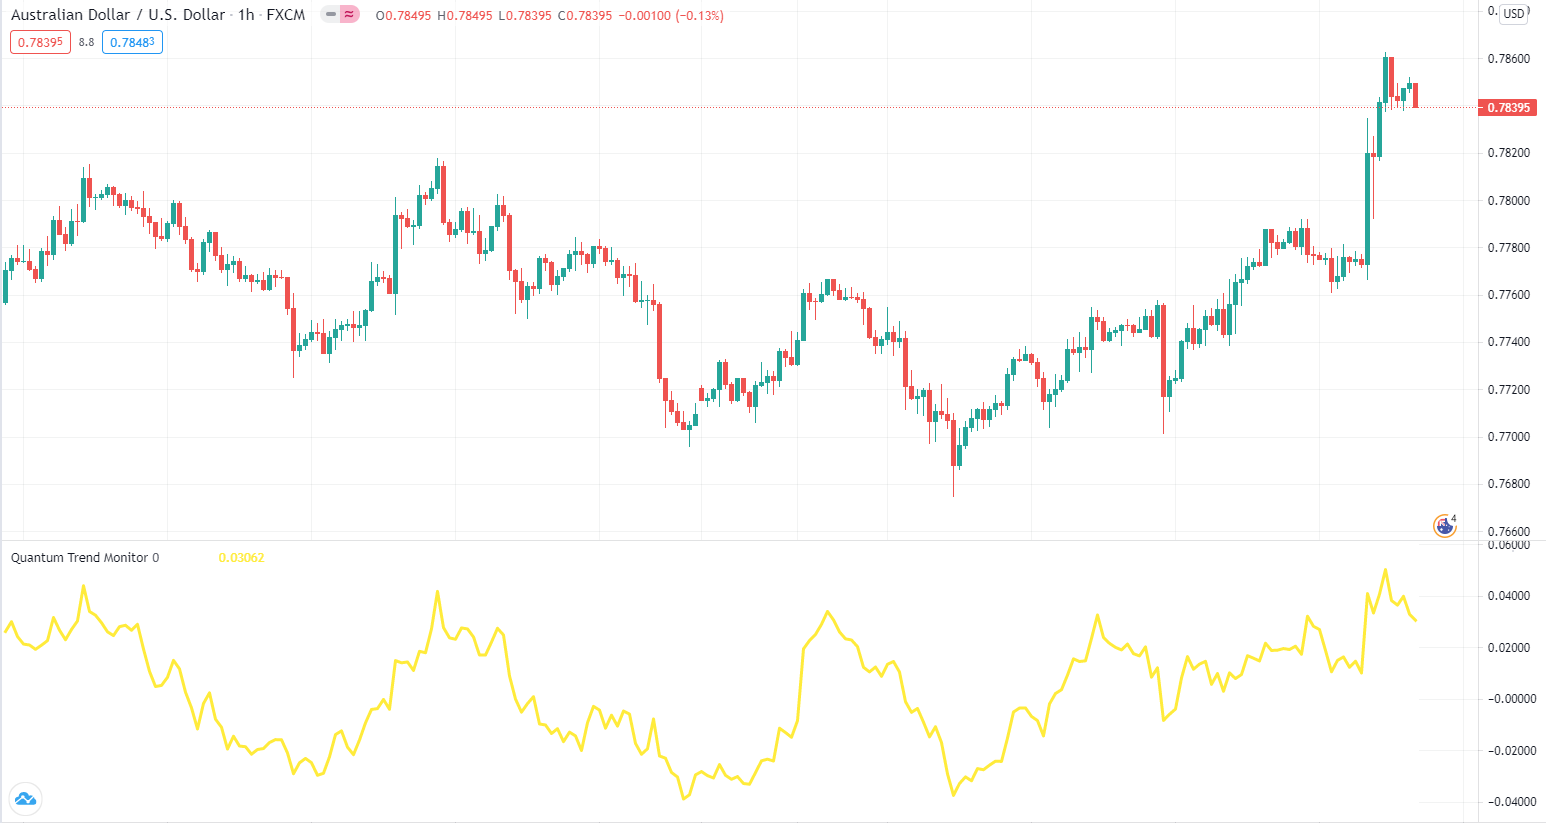
This input shows or hides the trend line plot in the Trend Monitor. The Trend Line is the yellow line that oscillates through the Trend Monitor and it is visible by default.
Show Trend Bar
This input shows or hides the colored bars in the Trend Monitor. These are the vertical bars that represent the strength of the trend under each candlestick and it is visible by default.
Style
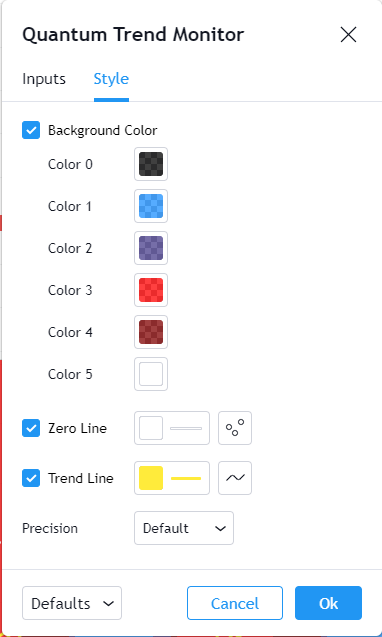
Background Color
This sets the colors of the Trend Monitor as the strength of trends change throughout the chart. You can click the color boxes to customize the color for each signal:
- Color 1 is set to blue which is the color assigned to strong bullish trend signal. You can click the color box to choose another color from a palette.
- Color 2 is set to red which is the color assigned to strong bearish trend signal. You can click the color box to choose another color from a palette.
- Color 3 is set to dark blue which is the color assigned to diminishing bullish trend signal. You can click the color box to choose another color from a palette.
- Color 4 is set to dark red which is the color assigned to diminishing bearish trend signal. You can click the color box to choose another color from a palette.
- Please do not change the settings of Color 0 and Color 5.
Zero Line
The Zero Line is the horizontal level where the Trend Line is oscillating. It is always found at 0. The trend is bullish when the trend line is above the zero line and bearish if the trend line is below it.
- You can hide or display the Zero Line using the checkbox.
- You can customize the color, opacity, and thickness of this plot by clicking the color box. The default color is white, and the thickness is set to 1.
- The second box allows you to change the plot type and enable the Price Line. The Price Line is a horizontal line that keeps track of the plot’s current value.
Trend Line
The Trend Line is a plot that oscillates around 0 and helps you see the path and strength of the trend as it changes its value from positive (bullish) to negative (bearish) and vice versa.
- You can hide or display the Trend Line using the checkbox.
- You can customize the color, opacity, and thickness of this plot by clicking the color box. The default color is yellow, and the thickness is set to 3.
- The second box allows you to change the plot type and enable the Price Line. The Price Line is a horizontal line that keeps track of the plot’s current value.
Precision
This determines the number of decimal places the indicator uses to display the current value of its plots. You can adjust this by choosing from a drop-down list.
Alerts
The Trend Monitor indicator has a total of 4 alert conditions.
Trend Change
Alert Conditions
- Strong Uptrend
- Strong Downtrend
- Diminishing Uptrend
- Diminishing Downtrend
Condition
Triggers when the trend change is detected
Alert message
Examples:
The following alert messages are used respectively with the corresponding Alert Conditions above
- Strong bullish trend at {current close price}
- Strong bearish trend at {current close price}
- Diminishing bullish trend at {current close price}
- Diminishing bearish trend at {current close price}