Overview
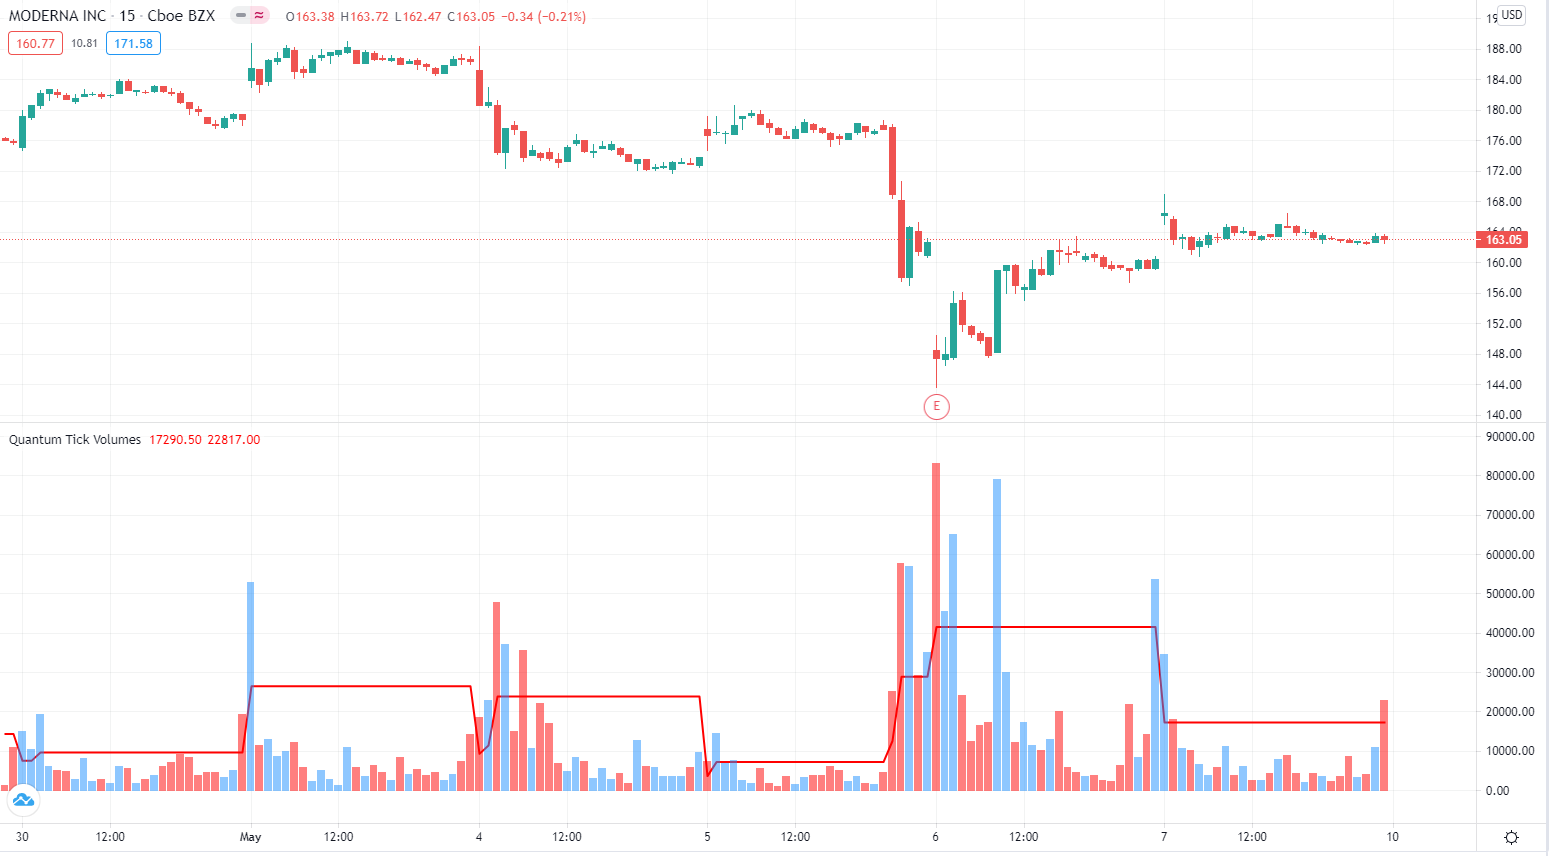
The Quantum Tick Volumes indicator has been designed to help you apply volume price analysis quickly and easily in all timeframes. The indicator takes the broker tick feed and paints the volume bar to match the price action. Where the price has closed higher, the volume bar is painted blue, and where it has closed lower, it is painted red. The indicator also displays a horizontal dotted line that marks half of the highest volume bar within each day. This helps to determine whether volume being displayed is very high, high, average or low, and to judge this against the price action accordingly.
- The Quantum Tick Volumes indicator works in all timeframes.
- For clarity, we find it is best applied to the bottom of the chart with the Quantum Trend Monitor immediately above.
Settings
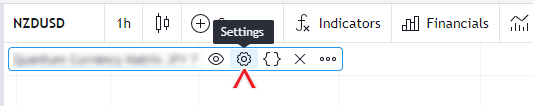
The Settings button appears as a small cog/gear icon beside the name of the indicator at the chart. Clicking the button shows a dialog box for configuring the Inputs and Style options.
Inputs
This indicator has no inputs.
Style
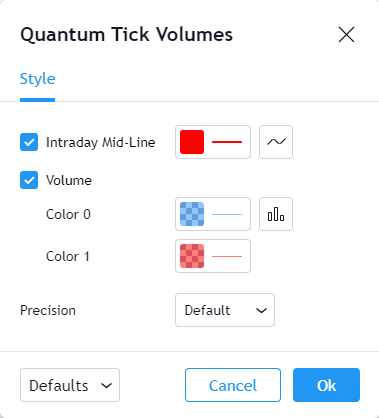
Intraday Mid-Line
This plot represents half of the current day’s highest volume bar within the current timeframe. This is an intraday calculation which means it is only visible in charts below the Daily timeframe.
- You can hide or display the Intraday Mid-Line using the checkbox.
- You can customize the color, opacity, and thickness of this plot by clicking the color box. The default color is red, and the thickness is set to 2.
- The second box allows you to change the plot type and enable the Price Line. The Price Line is a horizontal line that keeps track of the plot’s current value. Changing the plot type is not recommended.
Volume
This plot represents the amount of volume for each bar.
- You can hide or display the Volume plot using the checkbox.
- You can customize the colors, opacity, and thickness of this plot by clicking the color boxes. The first color box represents the volume bars under bullish candlesticks while the second ones are under bearish candlesticks. Bullish volume bars are blue and bearish volume bars are red by default.
- The box next to the color boxes allows you to change the plot type and enable the Price Line. The Price Line is a horizontal line that keeps track of the plot’s current value. Changing the plot type is not recommended.
Precision
This determines the number of decimal places the indicator uses to display the current value of its plots. You can adjust this by choosing from a drop-down list.
Alerts
The Tick Volumes indicator has 1 alert condition.
High Volume Bar
Alert Conditions
- High Volume
Condition
Triggers when the current intraday volume bar becomes greater than the middle volume line (half of the highest volume within the current day)
Alert message
Example:
- High volume detected at {current volume}