Overview
The words powerful, unique and game changing are ones that are often overused when applied to trading indicators, but for the Quantum Camarilla levels indicator, they truly describe this new and exciting indicator completely.
Why? Because the indicator has something to offer every trader, from the systematic to the discretionary and from swing trading to breakout trading. And it’s not an indicator which is simply used for entries. The Camarilla indicator delivers in all areas, from getting in to getting out as well as stop loss placement. All in one single indicator which perhaps explains its unique appeal and power to those traders in the know. Now, it’s all here just waiting for you to discover the power of the Camarilla protocol and apply this unique indicator to your own trading and investing tactics.
So, what is the Camarilla protocol, how does it work and what will it do for me? These are all good questions, so let’s get straight down to basics and explain how the indicator works and how you may wish to use it.
Let’s start with the last of these questions first, as this is one of the unique aspects to this indicator. Put simply it is a chameleon of an indicator and will appeal whether you are a more discretionary type of trader, making and taking decisions yourself, or if you prefer a more systematic or mechanical approach often associated with an EA for example. With the Camarilla levels indicator both approaches can be embraced and accommodated.
The Camarilla protocol has its roots in the open outcry trading pits, where traders considered floor pivots an essential tool. Based on these original ideas and incorporating the Camarilla equation we have developed a unique indicator which delivers clear and precise price-based support and resistance levels, which act as targets for profits, triggers for potential reversals, signals for possible breakouts, and finally stop loss placement. So, if you’re a swing or reversal trader, it’s the perfect indicator. Equally, if you prefer breakout trading, again it’s the perfect indicator. And all with predetermined and clear levels for any price objectives and profit targets, with stop loss placement, covered also.
In other words, a complete indicator, and one which is delivered with potential trading setups built in to help you see when key levels are being approached or breached.
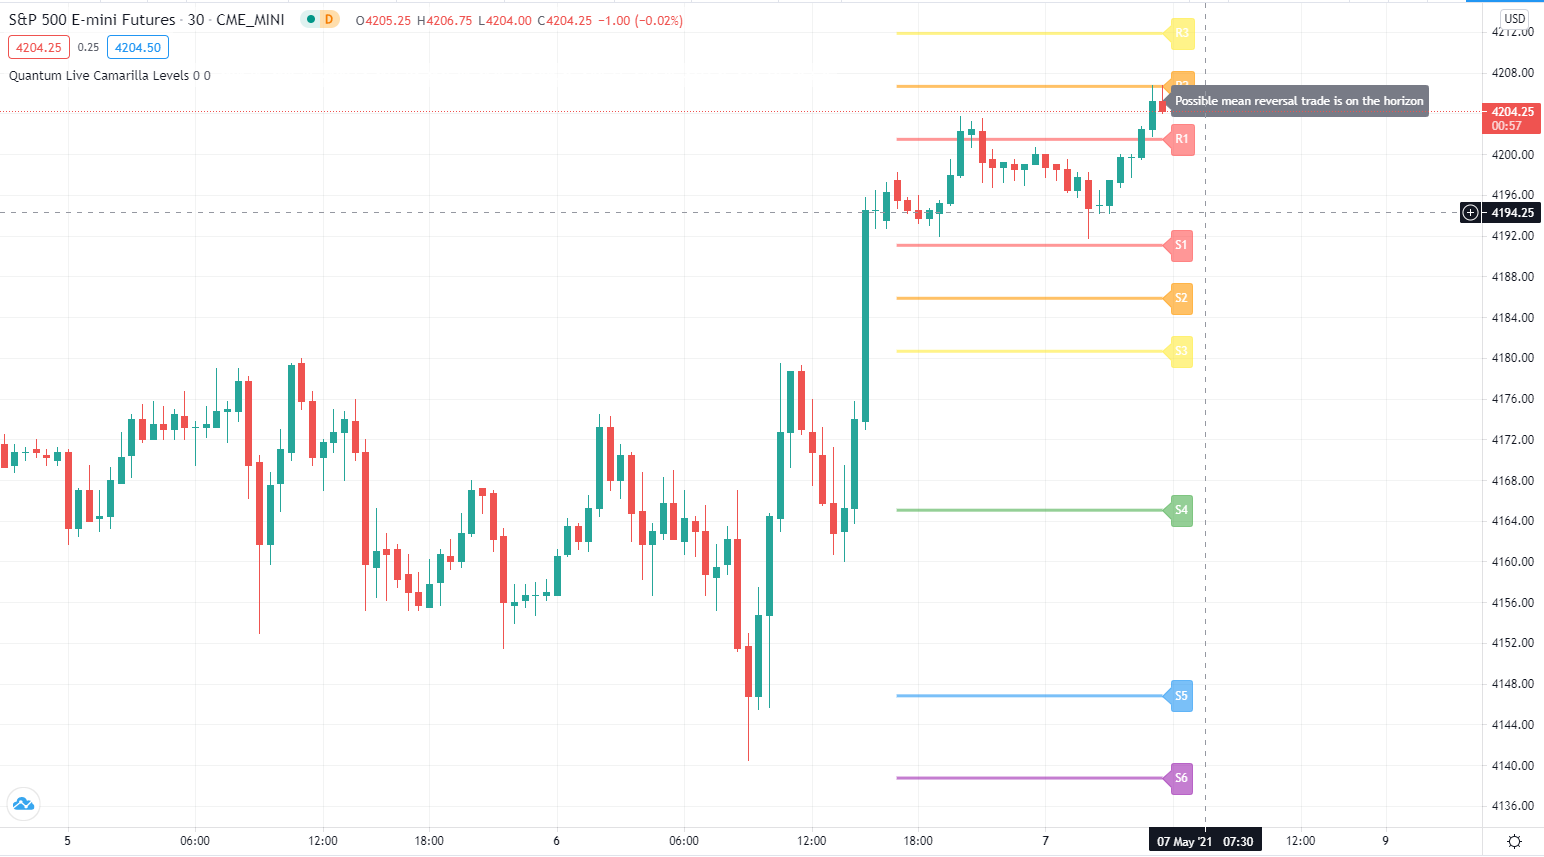
The indicator works in a complex way, but the data is presented simply using six levels above the price action and six levels below. Those above are labelled R1 to R6 and those below S1 to S6 with the region between R1 and S1 which we describe as the ‘buffer zone’. These levels are calculated for the different timeframes in different ways.
For daily timeframes and above the levels remain the same for the month, and they are then recalculated at the start of the new month. For intraday timeframes these are recalculated at the start of each new daily session.
Reversal Trading
For reversal trading the key levels to watch are S3 and R3. These are levels which when approached signal potential reversals. So when price is approaching and tests the S3 level below the buffer zone, a reversal to the upside may be on the horizon. In other words, a reversal from a bearish trend to a bullish trend in that timeframe. Equally, when price is approaching and testing the R3 level above the buffer zone, then a reversal is possible with the bullish price action reversing to bearish. In both cases the next level then denotes the level for the stop loss. For a reversal off the S3 level higher, the stop loss could be placed at S4 and for a reversal off the R3 level, the stop loss could be placed at the R4 level – assuming these levels fit your risk and money management rules.
The potential price targets are then as follows:
- For an R3 reversal the profit targets are from S1 to S3.
- For an S3 reversal the profit targets are from R1 to R3.
Breakout Trading
For breakout trading the key levels are the R4 above the buffer zone and the S4 below. These are levels at which the price is expected to breakout from the current region and develop a strong move away from the region. So, any move to test and break the R4 level is likely to see price continue higher and develop a strong trend. Equally if the S4 level is tested, then price is likely to continue lower and develop a strong trend.
- For an S4 breakout the profit targets are S5 to S6
- For an R4 breakout the profit targets are R5 to R6
Using the Camarilla levels in this way offers a complete solution to two distinct approaches to trading, and in addition, also provide potential target levels along with suggested stop loss positions, but as always these must meet your risk and money management rules.
And it is important to understand the indicator and associated levels can be adopted in two very distinct ways.
First, if you are more suited to mechanical trading where you feel more comfortable with a rule set, then the levels can be considered as your rule set. However, if you are more suited to discretionary trading then the indicator is a perfect complement to other Quantum indicators such as the support and resistance indicator, which again is one based purely on price, and so helps to reinforce levels delivered by the Camarilla protocol. Other indicators such as the Trend Monitor also work perfectly in association with this indicator.
The Camarilla levels indicator works in all timeframes on both standard and custom charts, and in every market, so can be used to trade stocks, commodities, forex or indices on the TradingView platform.
So, whether you’re a discretionary trader who prefers swing trading, or a breakout trader who is more systematic, the Camarilla levels indicator can deliver it all.
To help you when using the indicator, we have also included some simple messages to guide you as the various levels are approached and tested. These appear as follows:
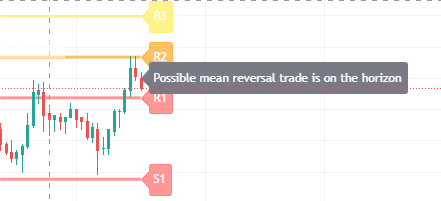
- If the current open price is between R3 and S3 the indicator displays the words – Possible mean reversal trade is on the horizon
- If the current open price is between S3 and S2 the indicator displays the words – Possible long position now on the horizon
- If the current open price is between R3 and R2 the indicator displays the words – Possible short position now on the horizon
- If the current open price is between R3 and R4 the indicator displays the words – Possible breakout now on the horizon for a long position
- If the current open price is between S3 and S4 the indicator displays the words – Possible breakout now on the horizon for a short position
- When there is nothing of interest, the indicator displays the message – Analysing the chart…
You can of course elect to switch these messages off, and they are only included to alert you to possible set ups occurring.
Settings
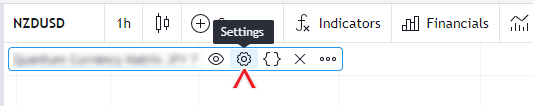
The Settings button appears as a small cog/gear icon beside the name of the indicator at the chart. Clicking the button shows a dialog box for configuring the Inputs and Style options.
Inputs
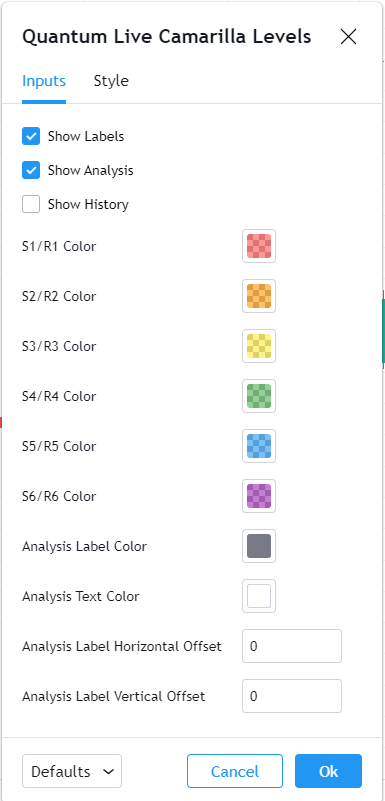
Show Labels
This input allows you to show or hide the label of each Camarilla level. The labels are visible by default.
Show Analysis
This input allows you to show or hide the analysis box where the messages are displayed. The analysis box is displayed by default.
Show History
This input allows you to choose whether to display the Camarilla levels in the bar history or only in the current period. The indicator displays the current Camarilla levels only by default. Plots are used if Show History is enabled and you can customize their appearance at the Style tab of the indicator settings.
S1/R1 Color
This input defines the color of the S1 and R1 Camarilla lines and labels. The default color is red.
S2/R2 Color
This input defines the color of the S2 and R2 Camarilla lines and labels. The default color is orange.
S3/R3 Color
This input defines the color of the S3 and R3 Camarilla lines and labels. The default color is yellow.
S4/R4 Color
This input defines the color of the S4 and R4 Camarilla lines and labels. The default color is green.
S5/R5 Color
This input defines the color of the S5 and R5 Camarilla lines and labels. The default color is blue.
S6/R6 Color
This input defines the color of the S6 and R6 Camarilla lines and labels. The default color is purple.
Analysis Label Color
This input defines the background color of the analysis box where the messages are displayed. The default color is gray.
Analysis Text Color
This input defines the text color of the analysis box where the messages are displayed. The default color is white.
Analysis Label Horizontal Offset
You can increase the value of this input to move the analysis box to the left side of the chart.
Analysis Label Vertical Offset
You can increase or decrease the value of this input to move the analysis box up or down in the chart.
Style
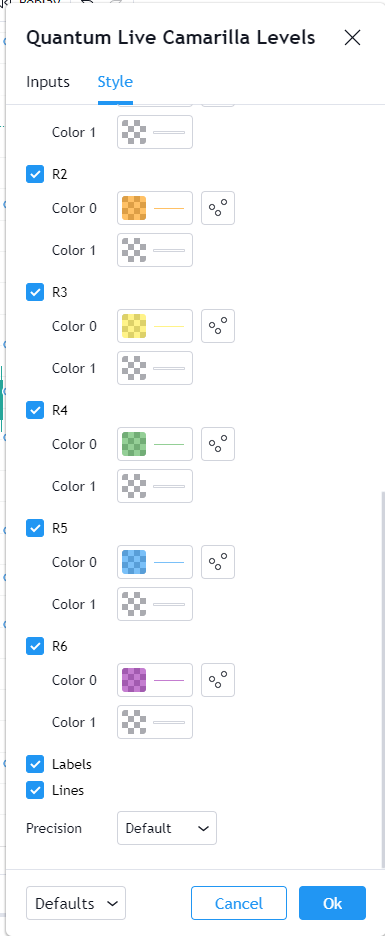
S1 to S6 and R1 to R6
These 12 plots are visible in the chart only when Show History input is enabled. You can use these style options to customize the appearance of each plot.
- Clicking the color box allows you to select a custom color for each plot but please note that this does not change the color of the plot’s accompanying label object. If you like to change the color of the line and its label, then please change the color through the Inputs section.
- You can also change the chart type of the plots by clicking the box next to the color box. To keep things simple and orderly, please keep the chart type to Circles or Line-type plots.
- We do not recommend enabling the Price Line but this option is available for you if this is something you like to try.
Labels
This option shows/hides the label objects used by the indicator. Please keep this option enabled.
Lines
This option shows/hides the line objects used by the indicator. Please keep this option enabled.
Precision
This determines the number of decimal places the indicator uses to display the current value of its plots. You can adjust this by choosing from a drop-down list.
Alerts
The Live Camarilla Levels indicator has a total of 17 alert conditions.
Analysis
Alert Conditions
- Possible mean reversal
- Possible long position
- Possible short position
- Possible breakout for a long position
- Possible break out for a short position
Condition
Triggers when the specific analysis message displayed by the indicator
Alert message
Examples:
The following alert messages are used respectively with the corresponding Alert Conditions above
- Possible mean reversal trade us on the horizon
- Possible long position now on the horizon
- Possible short position now on the horizon
- Possible breakout now on the horizon for a long position
- Possible breakout now on the horizon for a short position
Cross
Alert Conditions
- R1 Cross
- R2 Cross
- R3 Cross
- R4 Cross
- R5 Cross
- R6 Cross
- S1 Cross
- S2 Cross
- S3 Cross
- S4 Cross
- S5 Cross
- S6 Cross
Condition
Triggers when the current price crosses with any of the Camarilla levels (R1-R6, S1-S6)
Alert message
Examples:
- R1 crossed at {current close price}
- R5 crossed at {current close price}
- S2 crossed at {current close price}
- S6 crossed at {current close price} … and so on