Overview
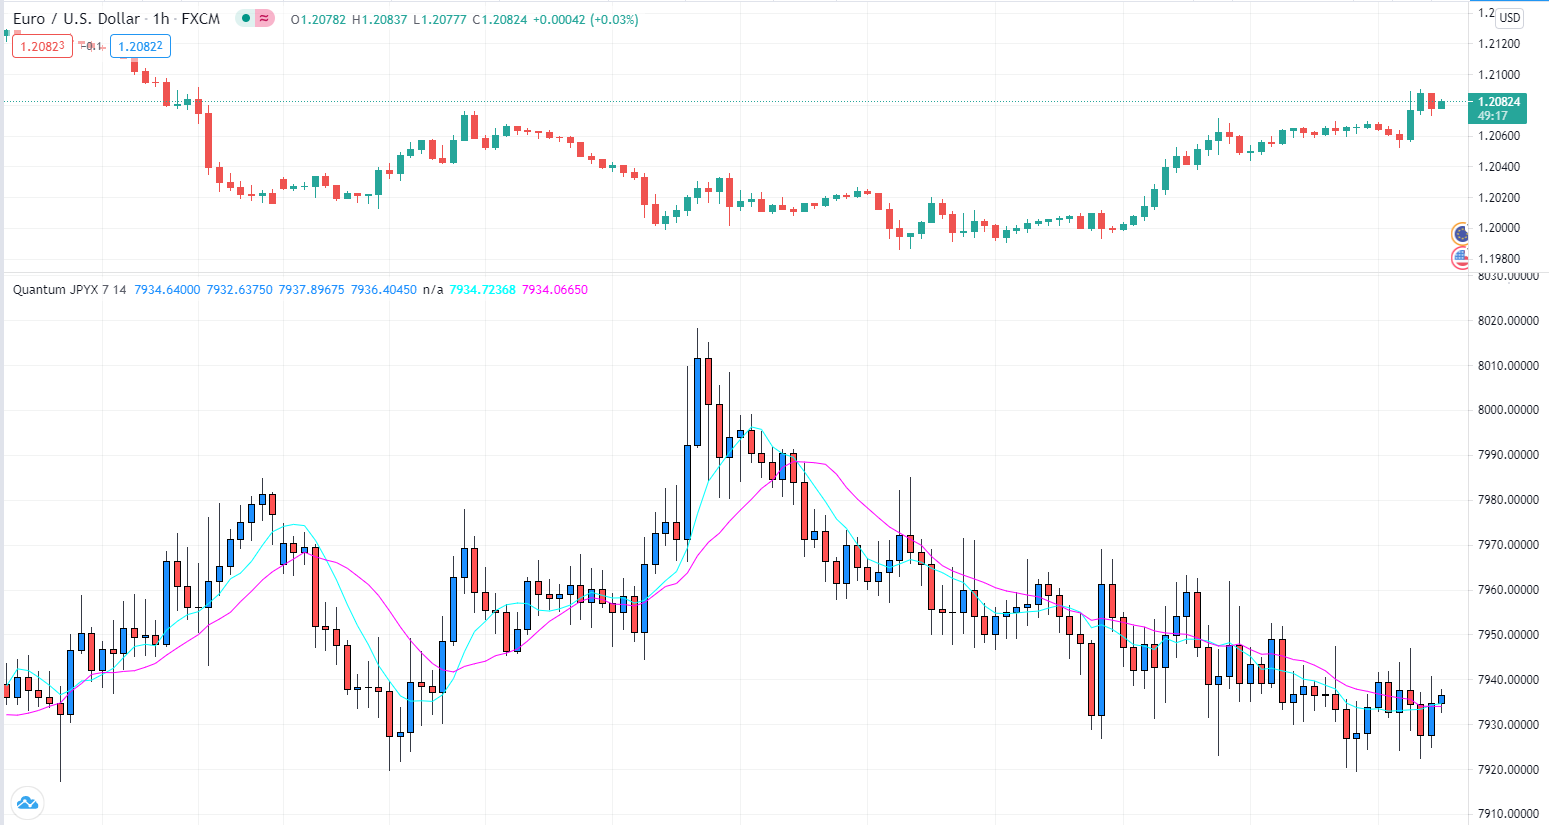
If the US dollar is the primary currency to consider in any analysis of the forex market, the second is the Japanese yen, and yet there are almost no indices which track this in a similar way. But once again, we have the answer and have therefore developed the JPYX index for the TradingView platform. This is based on the FXCM/Dow Jones index, and takes four major currencies, with an equal weighting to deliver the JPYX index as follows:
- Australian dollar (AUD) – 25%
- New Zealand dollar (NZD) – 25%
- Euro (EUR) – 25%
- US dollar (USD) – 25%
Once again, the index is based on a notional 10,000 mini lot contract size. It is our belief this simple index provides a ‘real world’ view of strength and weakness in the Japanese yen which is equally important in terms of risk analysis. Whilst the US dollar has increasingly been adopted to fund the carry trade, the Japanese yen remains the key currency in this respect, and with flows into and out of risk assets remaining pivotal for the currency, having an index to track its performance against other key currencies is crucial.
Like the Quantum USDX indicator, the Quantum JPYX indicator can be used in one of three ways:
- First, as an inverse indicator to a major currency pair, helping you get in, stay in and get out.
- Second, as a confirming indicator for the Quantum Currency Strength indicator, providing a perspective against other currencies.
- Finally, as the ultimate barometer of risk.
Whichever approach you adopt, you will no longer have to leave your TradingView platform for a view of the Japanese yen.
The Quantum JPYX indicator works in all timeframes.
Settings
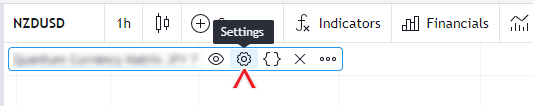
The Settings button appears as a small cog/gear icon beside the name of the indicator at the chart. Clicking the button shows a dialog box for configuring the Inputs and Style options.
Inputs
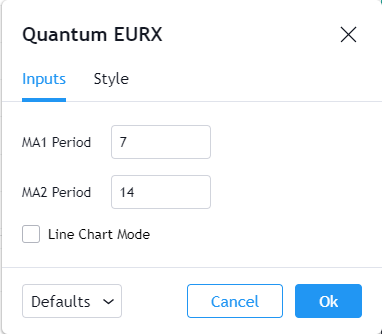
MA1 Period
This is the period of one of the 2 simple moving averages which are part of the JPYX indicator. It is set to 7 by default. Though this is the faster moving average of the two, you are free to set this to any other timeframe to suit your personal preferences.
MA2 Period
This is the period of the second simple moving average for the JPYX. It is set to 14 by default. Though this is the slower moving average, you are free to set this to any other time frame of your choice.
Line Chart Mode
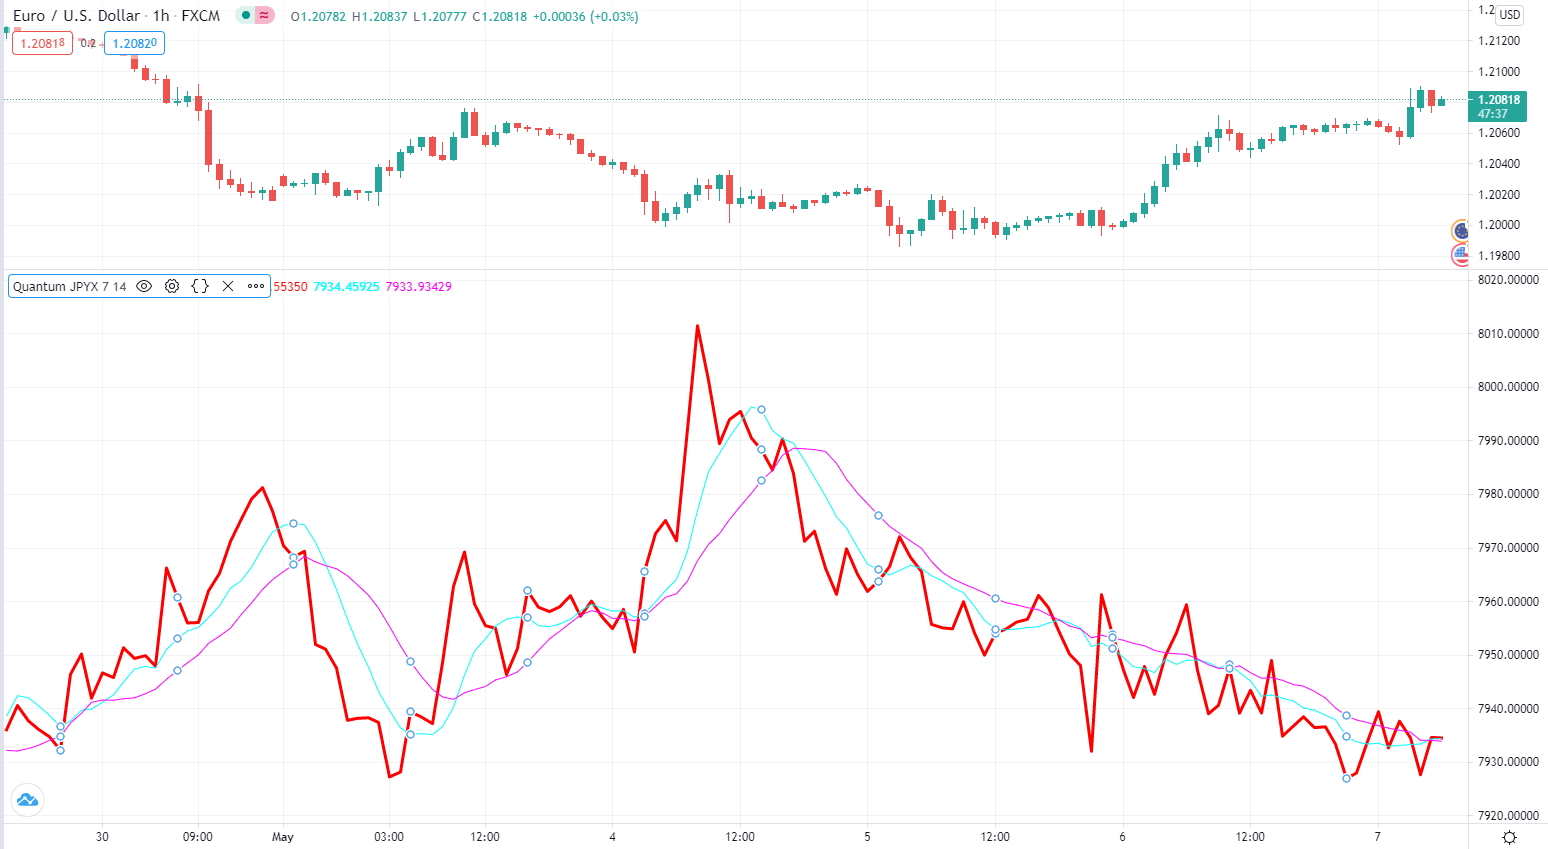
The Quantum JPYX indicator uses a candlestick plot by default, but if this property is enabled, it will use a line plot to display the index.
Style
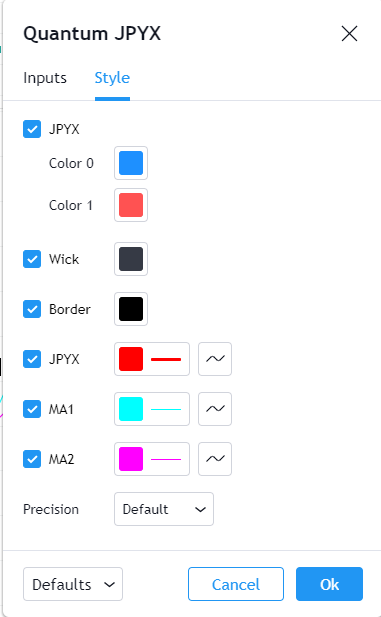
JPYX (candlestick)
This forms the body (open and close price) of the index’s candlesticks.
- You can hide or display all candlesticks (when Line Chart Mode is disabled) in the index using the checkbox.
- You can customize the color and opacity of the bullish and bearish candlesticks by clicking the color boxes. Color 0 is the color of bullish candlesticks which is blue while Color 1 is the color of bearish candlesticks which is red.
Wick
This forms the shadow (high and low price) of the index’s candlesticks.
- You can hide or display the wicks of the candlesticks in the index using the checkbox.
- You can customize the color and opacity of the wicks by clicking the color boxes.
Border
This is a thin line that wraps the body of the index’s candlesticks.
- You can hide or display the border of the candlesticks in the index using the checkbox.
- You can customize the color and opacity of the border by clicking the color boxes.
JPYX (line)
This line plots the index when the indicator is in Line Chart Mode.
- You can hide or display the JPYX line (when Line Chart Mode is enabled) using the checkbox.
- You can customize the color, opacity, and thickness of this plot by clicking the color box. The default color is red, and the thickness is set to 3.
- The second box allows you to change the plot type and enable the Price Line. The Price Line is a horizontal line that keeps track of the plot’s current value. Changing the plot type is not recommended.
MA1
This line plots the first simple moving average on the indicator.
- You can hide or display the MA1 line using the checkbox.
- You can customize the color, opacity, and thickness of this plot by clicking the color box. The default color is cyan, and the thickness is set to 1.
- The second box allows you to change the plot type and enable the Price Line. The Price Line is a horizontal line that keeps track of the plot’s current value. Changing the plot type is not recommended.
MA2
This line plots the second simple moving average on the indicator.
- You can hide or display the MA2 line using the checkbox.
- You can customize the color, opacity, and thickness of this plot by clicking the color box. The default color is magenta, and the thickness is set to 1.
- The second box allows you to change the plot type and enable the Price Line. The Price Line is a horizontal line that keeps track of the plot’s current value. Changing the plot type is not recommended.
Precision
This determines the number of decimal places the indicator uses to display the current value of its plots. You can adjust this by choosing from a drop-down list.
Alerts
The JPYX indicator has 1 alert condition.
MA Crosses
Alert Conditions
- JPYX MA Cross
Condition
Triggers when the 2 moving average plots of the indicator cross each other
Alert message
Example:
- JPYX moving averages crossed at MA1 = {value of first MA} | MA2 = {value of second MA}