Overview
The Euro Currency Index, or EURX as we refer to it, quantifies and displays strength and weakness of the single currency. As the index rises it suggests strength in the euro against a basket of currencies. As the index falls this signals weakness. The Quantum EURX is calculated from a basket of four currencies with each currency having an equal weighting of 25%. These currencies are as follows:
- US Dollar
- Japanese Yen
- British Pound
- Australian Dollar
The indicator can be used in one of three ways:
- First, to identify and confirm strength and weakness in major and cross-currency euro pairs, helping you get in, stay in, and get out.
- Second, as a confirming indicator for the Quantum Currency Strength indicator, providing a perspective against other currencies.
- Finally, to provide a relevant and consolidated view of the Euro.
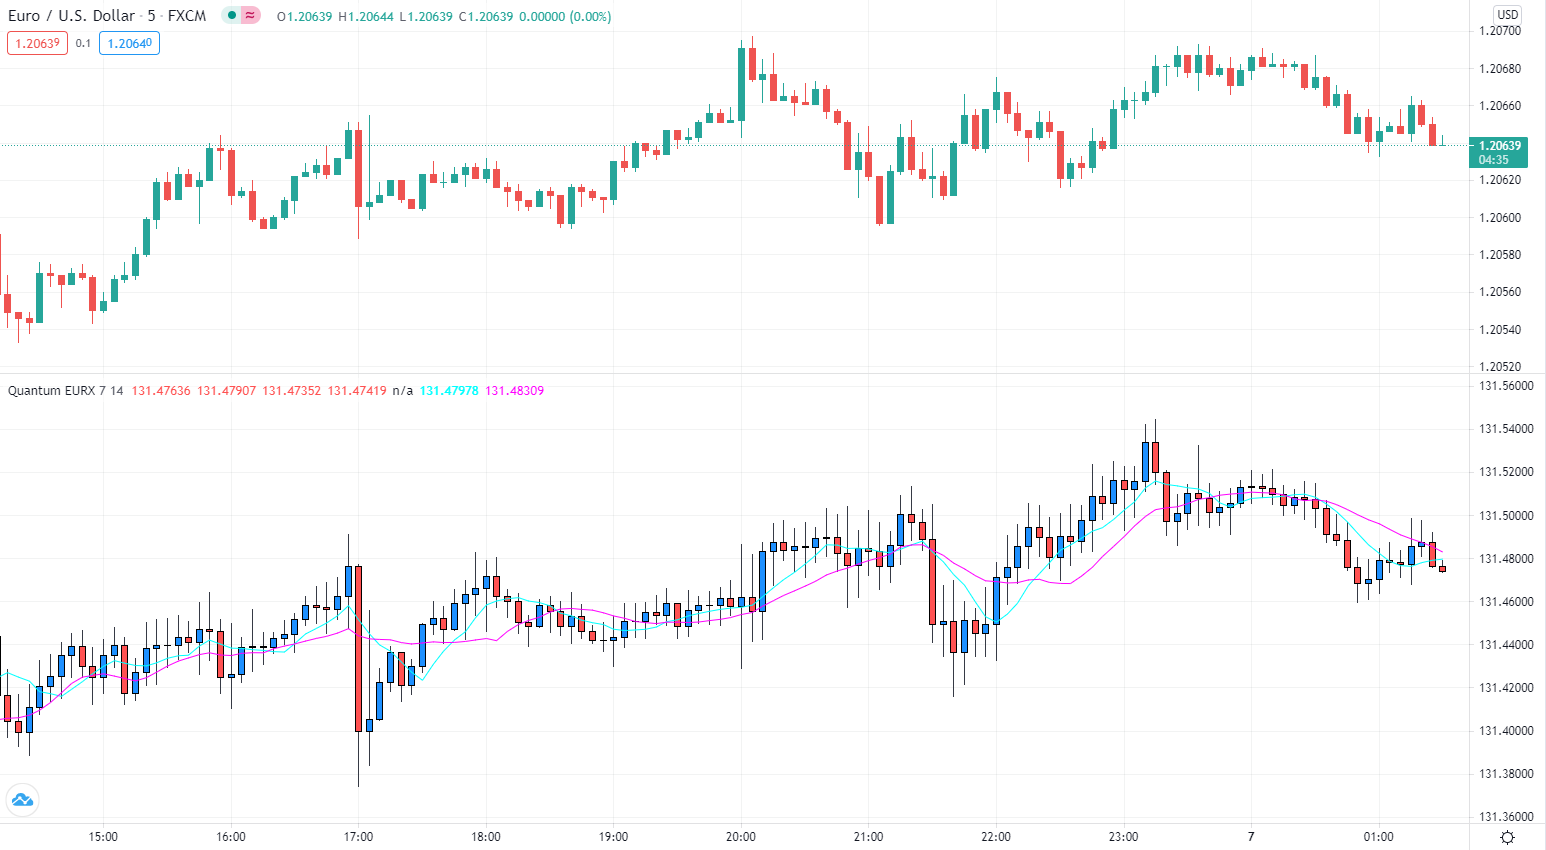
The indicator plots strength and weakness of the Euro as a candlestick chart in a separate indicator window when you attach it to the chart. In addition, there are two configurable simple moving averages to make chart reading easier.
Whether the single currency survives in the longer term, is one for debate. In the meantime, having a quick and easy way to view the euro and its performance against other currencies is key. The Quantum EURX indicator does just that – removing the hard work and presenting a chart which is simple and easy to read, and which provides an instant view of the euro and whether it is rising or falling, second by second and minute by minute. When used in tandem with the Quantum Currency Strength Indicator it is the closest you can come to having your own euro crystal ball.
Settings
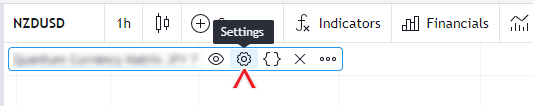
The Settings button appears as a small cog/gear icon beside the name of the indicator at the chart. Clicking the button shows a dialog box for configuring the Inputs and Style options.
Inputs
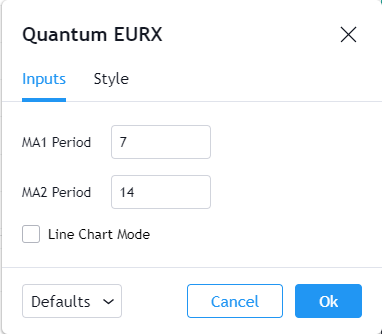
MA1 Period
This is the period of one of the 2 simple moving averages which are part of the EURX indicator. It is set to 7 by default. Though this is the faster moving average of the two, you are free to set this to any other timeframe to suit your personal preferences.
MA2 Period
This is the period of the second simple moving average for the EURX. It is set to 14 by default. Though this is the slower moving average, you are free to set this to any other time frame of your choice.
Line Chart Mode
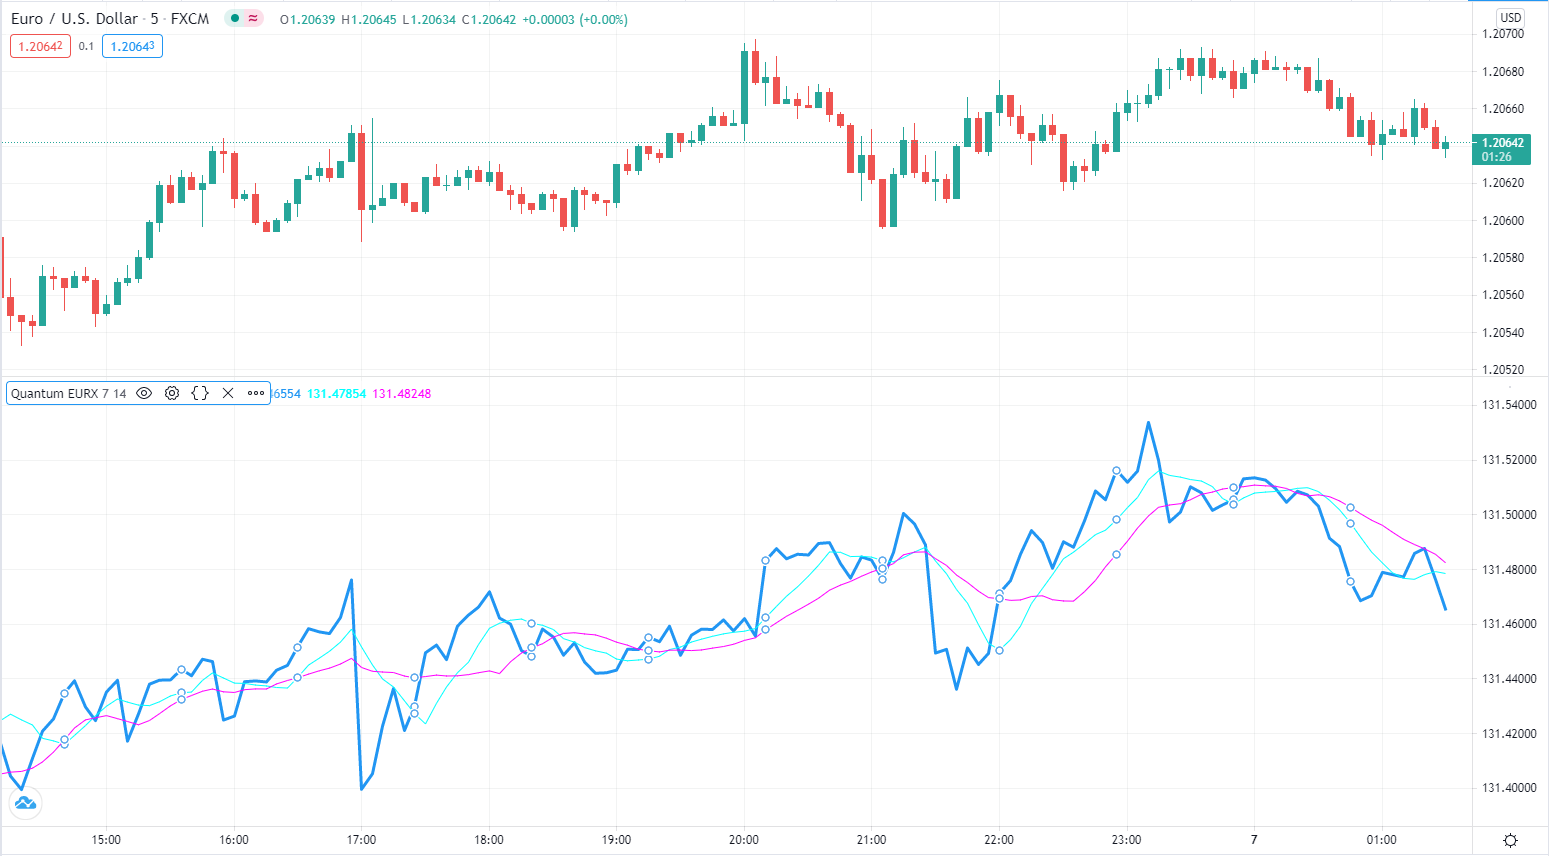
The Quantum EURX indicator uses a candlestick plot by default, but if this property is enabled, it will use a line plot to display the index.
Style
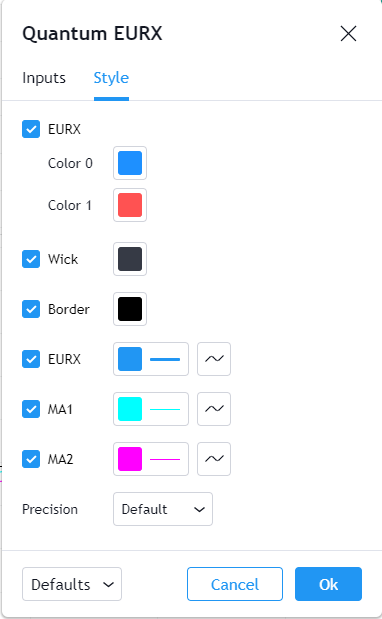
EURX (candlestick)
This forms the body (open and close price) of the index’s candlesticks.
- You can hide or display all candlesticks (when Line Chart Mode is disabled) in the index using the checkbox.
- You can customize the color and opacity of the bullish and bearish candlesticks by clicking the color boxes. Color 0 is the color of bullish candlesticks which is blue while Color 1 is the color of bearish candlesticks which is red.
Wick
This forms the shadow (high and low price) of the index’s candlesticks.
- You can hide or display the wicks of the candlesticks in the index using the checkbox.
- You can customize the color and opacity of the wicks by clicking the color boxes.
Border
This is a thin line that wraps the body of the index’s candlesticks.
- You can hide or display the border of the candlesticks in the index using the checkbox.
- You can customize the color and opacity of the border by clicking the color boxes.
EURX (line)
This line plots the index when the indicator is in Line Chart Mode.
- You can hide or display the EURX line (when Line Chart Mode is enabled) using the checkbox.
- You can customize the color, opacity, and thickness of this plot by clicking the color box. The default color is blue, and the thickness is set to 3.
- The second box allows you to change the plot type and enable the Price Line. The Price Line is a horizontal line that keeps track of the plot’s current value. Changing the plot type is not recommended.
MA1
This line plots the first simple moving average on the indicator.
- You can hide or display the MA1 line using the checkbox.
- You can customize the color, opacity, and thickness of this plot by clicking the color box. The default color is cyan, and the thickness is set to 1.
- The second box allows you to change the plot type and enable the Price Line. The Price Line is a horizontal line that keeps track of the plot’s current value. Changing the plot type is not recommended.
MA2
This line plots the second simple moving average on the indicator.
- You can hide or display the MA2 line using the checkbox.
- You can customize the color, opacity, and thickness of this plot by clicking the color box. The default color is magenta, and the thickness is set to 1.
- The second box allows you to change the plot type and enable the Price Line. The Price Line is a horizontal line that keeps track of the plot’s current value. Changing the plot type is not recommended.
Precision
This determines the number of decimal places the indicator uses to display the current value of its plots. You can adjust this by choosing from a drop-down list.
Alerts
The EURX indicator has 1 alert condition.
MA Crosses
Alert Conditions
- EURX MA Cross
Condition
Triggers when the 2 moving average plots of the indicator cross each other
Alert message
Example:
- EURX moving averages crossed at MA1 = {value of first MA} | MA2 = {value of second MA}