Overview

For ships at sea, the lighthouse flashing its constant signals is a warning of one thing – danger ahead. The Quantum Dynamic Volatility indicator is the trader’s lighthouse. It is warning of possible danger ahead, signalling extreme volatility in the market, and potential hazards for the unwary trader.
The indicator signals this volatility, using average true range. It is constantly scanning the price action for extremes, and when they arrive, are signaled on the chart with a purple arrow, above and below the candle. This is a warning signal to stay out. What often happens following these periods of volatility is that the price action then retraces, and trades within the spread of the candle or bar. The reason for this is easy to understand. The market has moved sharply higher or lower on a news release. Excited forex traders then jump into the move, hoping for some easy money. The market makers then reverse the price action, leaving these traders trapped in weak positions.
This happens repeatedly and is the reason that we developed the indicator. To signal these volatile bars and candles in real-time, and the associated warning to take care. Generally, once the signal is triggered, you will find the market moving back into the range of the bar or candle, before moving breaking higher or lower in due course. Once the price action has been validated by a clear move away, then it is safe to consider taking a position in the market once again.
The Quantum Dynamic Volatility indicator is sending a clear warning. It’s warning of high risk and telling you to take care. The indicator paints two arrows, one above and one below the candle or bar.
The Quantum Dynamic Volatility indicator works in time-based charts and other chart types.
Settings
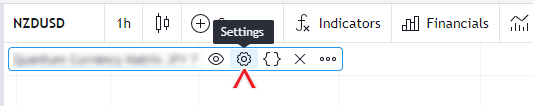
The Settings button appears as a small cog/gear icon beside the name of the indicator at the chart. Clicking the button shows a dialog box for configuring the Inputs and Style options.
Inputs
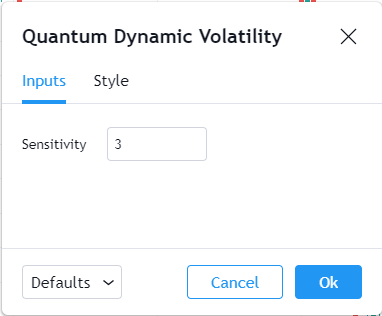
Sensitivity
You can Increase the value of this input by increments of 1 to allow the indicator to become more sensitive to bars that exhibit volatility.
Style
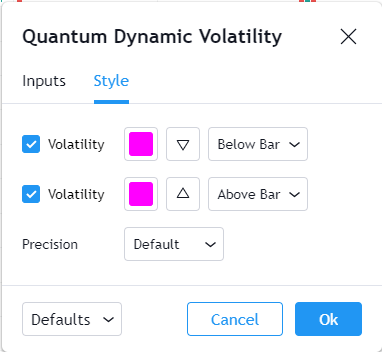
Volatility (x2)
The indicator uses 2 plots to indicate volatility by adding triangles above and below the volatile candlestick.
- You can hide or display the Volatility signals using the checkbox in these plots.
- You can customize the color and opacity of these plots by clicking the color box. The default color is magenta.
- The second box allows you to change the plot shape from a set of symbols. Their default symbols an upside-down triangle and a triangle, above and below the bar.
- The third box sets the position of the plots with each one above and below the bar respectively.
Precision
This determines the number of decimal places the indicator uses to display the current value of its plots. You can adjust this by choosing from a drop-down list.
Alerts
The Dynamic Volatility indicator has 1 alert condition.
Volatility
Alert Conditions
- Volatility
Condition
Triggers when a new volatile candle is detected
Alert message
Example:
- Volatile price action detected at {current close price}