Overview
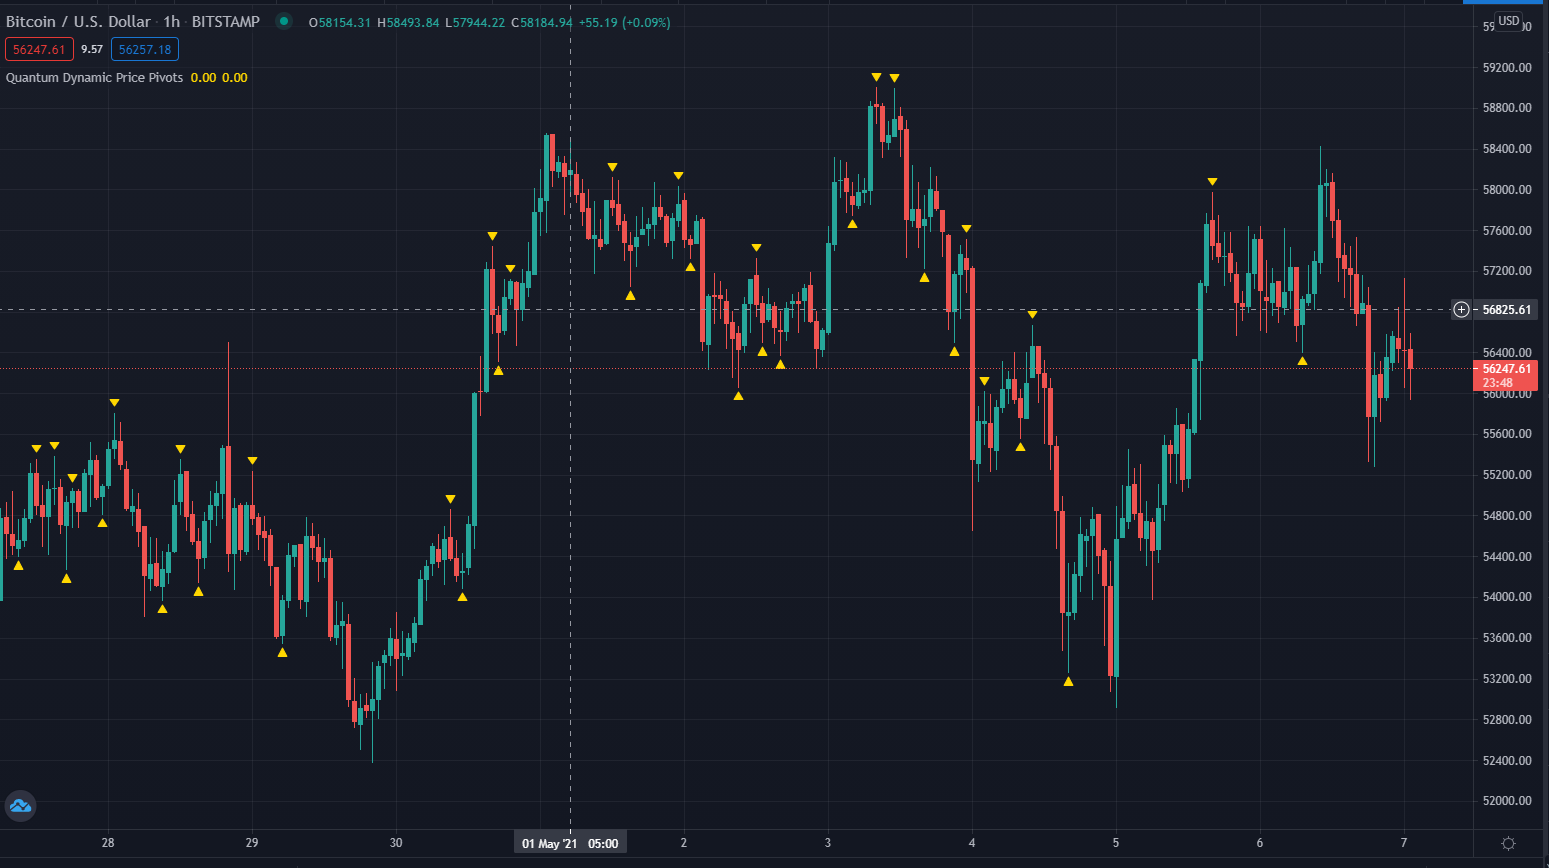
The Dynamic Price Pivots indicator has been designed and developed to help you take advantage of leading price action in several different ways. We call it dynamic because that’s what it is, dynamically signaling changes in sentiment at the live edge of the market using a three-candle pattern. If the centre candle has lower highs and lower lows than the candles on either side, then a pivot low is triggered, and conversely, if the centre candle has higher highs and higher lows, a pivot high is formed. The indicator is triggered on the close of the candle.
The Dynamic Price Pivots indicator can be used in several different ways, which is why we refer to it as the ‘Swiss Army Knife’ of trading indicators – a simple yet powerful indicator.
First, the indicator can be used to identify changes in market sentiment, as the market ebbs and flows from bullish to bearish and back again. Second, the indicator can be used to identify support and resistance regions as they build in real-time. The pivot highs and the pivot lows define the floor and ceiling of support and resistance dynamically. Finally, the pivots can also be used to define the upper and lower regions of trends, again, as they build dynamically.
The Dynamic Price Pivots indicator is not an entry or exit signal indicator, but one that is used with a variety of others, including volume, to help define the market state in real-time. Are you in a congestion phase which is building, or a trend which is developing? The Dynamic Price Pivots indicator will help to tell frame the market conditions, which you can then confirm with all your other trading indicators.
The Quantum Dynamic Price Pivots indicator works in time-based charts and other chart types.
Settings
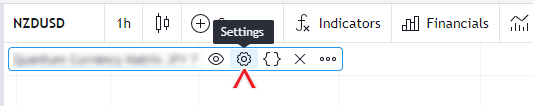
The Settings button appears as a small cog/gear icon beside the name of the indicator at the chart. Clicking the button shows a dialog box for configuring the Inputs and Style options.
Inputs
This indicator has no inputs.
Style
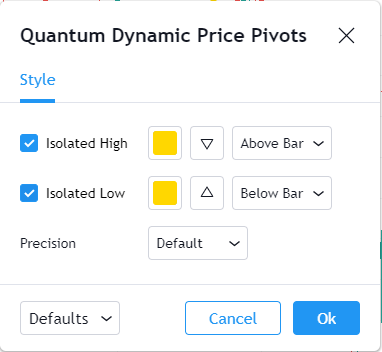
TradingView allows you to customize the indicator’s appearance by changing the properties of its plots.
Isolated Low
This plot represents the Isolated Low candlestick pattern which is a bullish signal and shown as a triangle pointing upward.
- You can hide or display the Isolated Low signals using the checkbox.
- You can customize the color and opacity of this plot by clicking the color box. The default color is yellow.
- The second box allows you to change the plot shape from a set of symbols. Its default symbol is a triangle.
- The third box sets the position of the plot. To avoid confusion, please refrain from changing the value of this setting which should always be “Above Bar”
Isolated High
This plot represents the Isolated High candlestick pattern which is a bearish signal and shown as a triangle pointing downward.
- You can hide or display the Isolated High signals using the checkbox.
- You can customize the color and opacity of this plot by clicking the color box. The default color is yellow.
- The second box allows you to change the plot shape from a set of symbols. Its default symbol is an upside down triangle.
- The third box sets the position of the plot. To avoid confusion, please refrain from changing the value of this setting which should always be “Below Bar”
Precision
This determines the number of decimal places the indicator uses to display the current value of its plots. You can adjust this by choosing from a drop-down list.
Alerts
The Dynamic Price Pivots indicator has a total of 2 alert conditions.
Isolated High
Alert Conditions
- Isolated High
Condition
Triggers when a new downward arrow is printed on the chart
Alert message
Example:
- Downward pivot detected at {current close price}
Isolated Low
Alert Conditions
- Isolated Low
Condition
Triggers when a new upward arrow is printed on the chart
Alert message
Example:
- Upward pivot detected at {current close price}