Overview
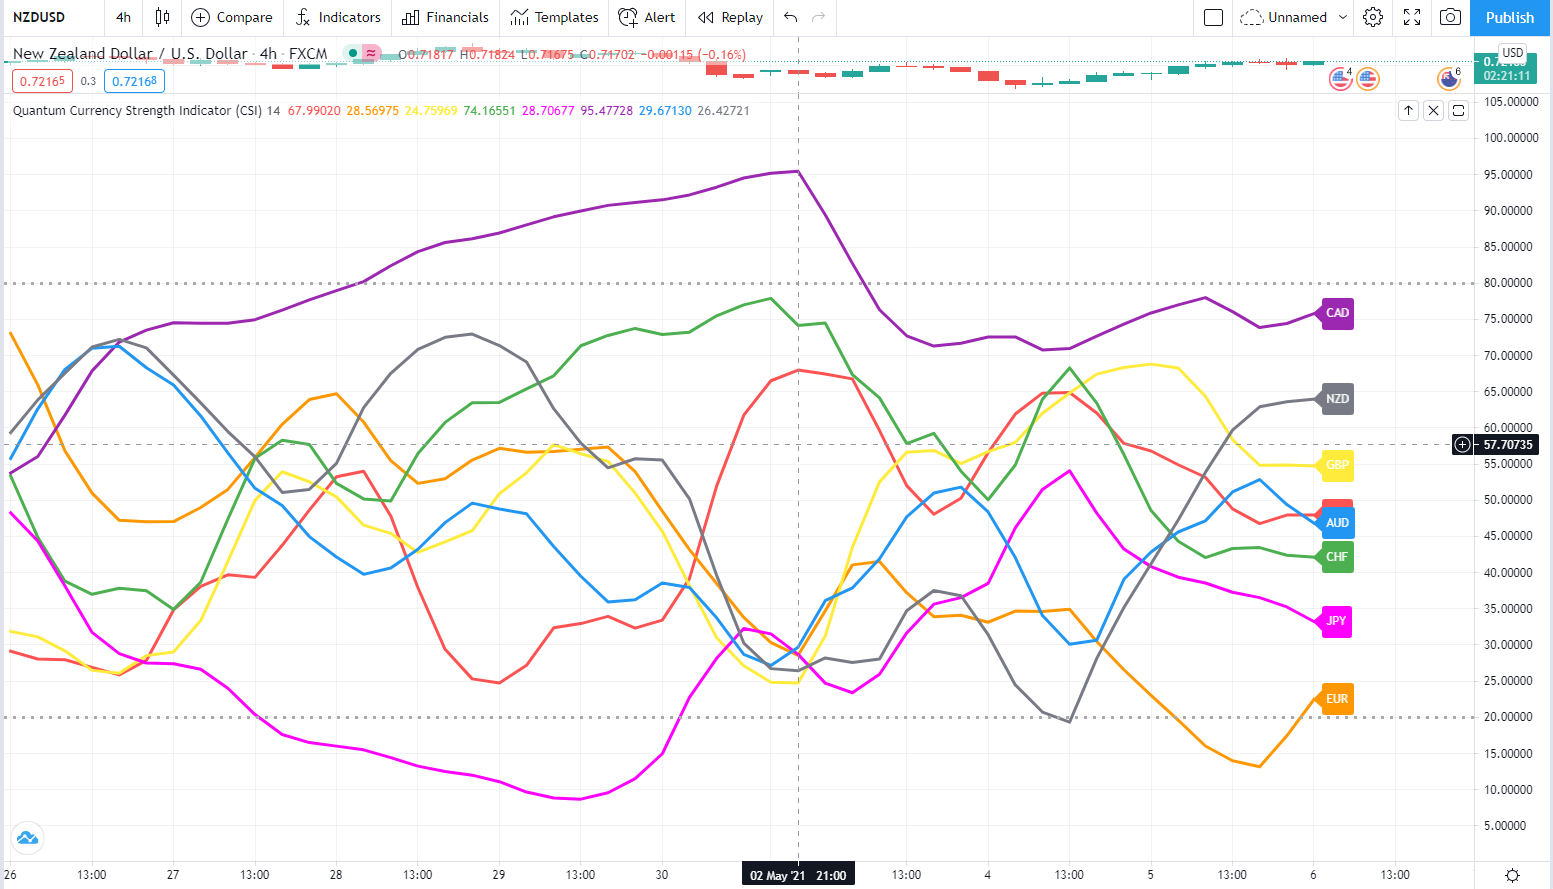
The Quantum Currency Strength Indicator has been designed to show you easily and quickly when a currency is moving strongly in one direction or another, either to an oversold state, or to an overbought state. Currencies and currency pairs move constantly from one to the other in all timeframes.
These are the points at which a currency is likely to reverse and change trend. The overbought and oversold regions on the indicator are defined by the solid grey lines at 20 and 80, and once these regions are approached then this is a signal for further analysis on the chart. Using the currency strength indicator on TradingView in multiple timeframes is an excellent way to see whether a currency is rising or falling across several timeframes, adding a further dimension to your analysis, and allowing you to quantify the risk on any trade in a more detailed way.
Whilst this indicator has been designed to show you when currencies are potentially overbought or oversold, the Quantum Currency Strength Indicator will also show you when currencies are in congestion phases as they meander and bunch together. Typically this is seen ahead of major news releases as the currency markets pause and wait before the release.
The indicator is your radar on the market, guiding you to those currency pairs which may be rising strongly or falling strongly, and just as important those pairs which are not moving at present.
Finally, the indicator will also help you to monitor current positions, with the indicator showing you when a currency has moved from one extreme to another and perhaps signaling a potential reversal in the opposite direction.
Your Quantum CSI currency strength indicator can be applied to any chart of any symbol. The chart does not influence or affect the appearance or performance of the indicator. For example, you can apply the indicator to a GBP/USD, a EUR/USD, or a USD/CHF, or any other pair. The indicator will display in an identical way on each chart.
The indicator will work in all timeframes from seconds to minutes, hours, and months on the TradingView platform.
When you first apply the indicator, please allow a few seconds for the data to build in history.
The dotted grey lines at the top and bottom of the indicator (80 at the top) and (20 at the bottom) are not designed as an entry or exit signal. They are simply there to give a guide as to when a currency is approaching or moving into an oversold or overbought state, in the current timeframe.
Currency lines
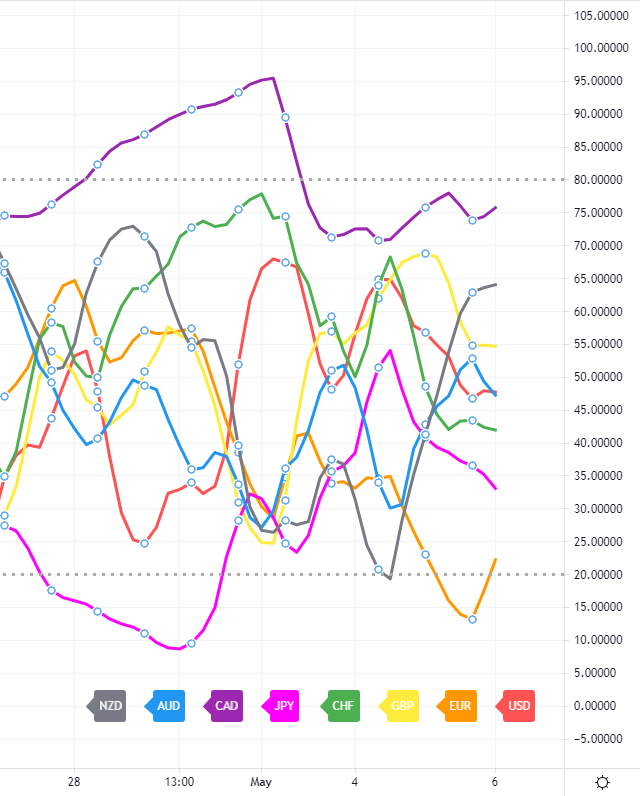
Each currency is represented by a line which is color coded as follows:
- US dollar – red
- Euro – orange
- British pound – yellow
- Swiss franc – green
- Japanese yen – magenta
- Canadian dollar – purple
- Australian dollar – blue
- New Zealand dollar – grey
Settings
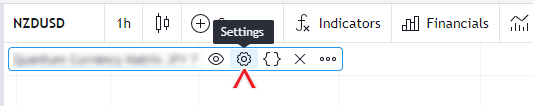
The Settings button appears as a small cog/gear icon beside the name of the indicator at the chart. Clicking the button shows a dialog box for configuring the Inputs and Style options.
Inputs
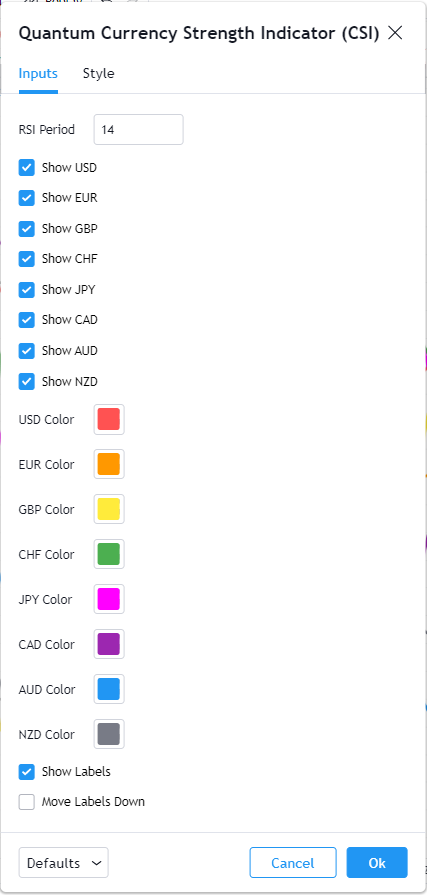
RSI Period
This setting is used to ‘fine tune’ the internal RSI of the currency strength indicator. Increasing the value makes the indicator less responsive to price movement, thus the steepness of the curves decreases. A higher Period also means currencies are less likely to cross the 80 and 20 lines. Conversely, decreasing it, makes the indicator more responsive to price movement, thus the steepness of the curves increases. A lower period also means currencies are more likely to cross the 80 and 20 lines and stay there for longer periods of time. The recommended settings are between a minimum of 7 and a maximum of 14. For medium to longer term trading approaches the higher period is recommended (towards 14 or above), whilst for faster scalping trading approaches, a lower period can be applied (towards 7 or below).
Show USD
This input allows you to show or hide the USD line plot and its respective label.
Show EUR
This input allows you to show or hide the EUR line plot and its respective label.
Show GBP
This input allows you to show or hide the GBP line plot and its respective label.
Show CHF
This input allows you to show or hide the CHF line plot and its respective label.
Show JPY
This input allows you to show or hide the JPY line plot and its respective label.
Show CAD
This input allows you to show or hide the CAD line plot and its respective label.
Show AUD
This input allows you to show or hide the AUD line plot and its respective label.
Show NZD
This input allows you to show or hide the NZD line plot and its respective label.
USD Color
This input allows you to choose the color of the USD line plot and its respective label.
EUR Color
This input allows you to choose the color of the EUR line plot and its respective label.
GBP Color
This input allows you to choose the color of the GBP line plot and its respective label.
CHF Color
This input allows you to choose the color of the CHF line plot and its respective label.
JPY Color
This input allows you to choose the color of the JPY line plot and its respective label.
CAD Color
This input allows you to choose the color of the CAD line plot and its respective label.
AUD Color
This input allows you to choose the color of the AUD line plot and its respective label.
NZD Color
This input allows you to choose the color of the NZD line plot and its respective label.
Show Labels
This input allows you to hide or display the labels of all the currencies.
Move Labels Down
Checking this input moves the labels of all the currencies at the bottom part of the indicator. This is disabled by default which puts the labels at the tip of each currency line plot they represent.
Style
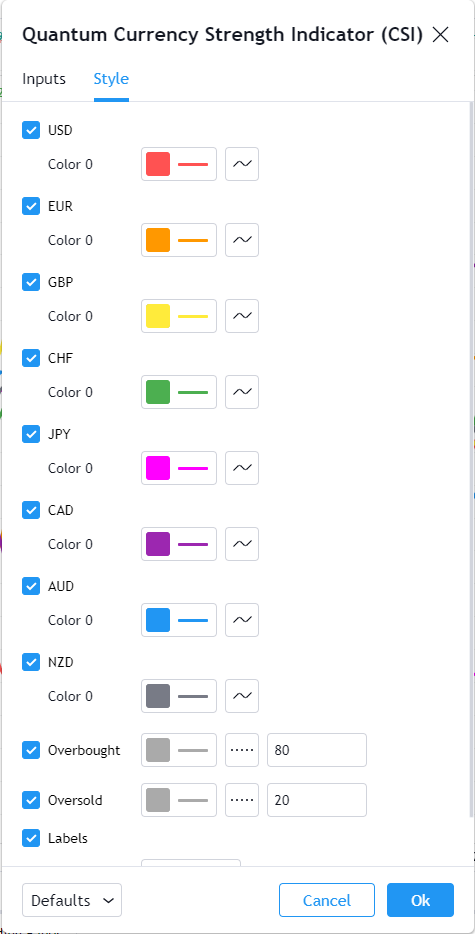
TradingView allows you to customize the indicator’s appearance by changing the properties of its plots.
USD
This line represents the US Dollar currency on the CSI.
- You can hide or display the USD currency line using the checkbox.
- You can customize the color, opacity, and thickness of this plot by clicking the color box. The default color is red, and the thickness is set to 3. Please do not change the color setting here if you also like to change the color of the currency label.
- The second box allows you to change the plot type and enable the Price Line. The Price Line is a horizontal line that keeps track of the plot’s current value. Changing the plot type is not recommended.
EUR
This line represents the Euro currency on the CSI.
- You can hide or display the EUR currency line using the checkbox.
- You can customize the color, opacity, and thickness of this plot by clicking the color box. The default color is orange, and the thickness is set to 3. Please do not change the color setting here if you also like to change the color of the currency label.
- The second box allows you to change the plot type and enable the Price Line. The Price Line is a horizontal line that keeps track of the plot’s current value. Changing the plot type is not recommended.
GBP
This line represents the British Pound currency on the CSI.
- You can hide or display the GBP currency line using the checkbox.
- You can customize the color, opacity, and thickness of this plot by clicking the color box. The default color is yellow, and the thickness is set to 3. Please do not change the color setting here if you also like to change the color of the currency label.
- The second box allows you to change the plot type and enable the Price Line. The Price Line is a horizontal line that keeps track of the plot’s current value. Changing the plot type is not recommended.
CHF
This line represents the Swiss Franc currency on the CSI.
- You can hide or display the CHF currency line using the checkbox.
- You can customize the color, opacity, and thickness of this plot by clicking the color box. The default color is green, and the thickness is set to 3. Please do not change the color setting here if you also like to change the color of the currency label.
- The second box allows you to change the plot type and enable the Price Line. The Price Line is a horizontal line that keeps track of the plot’s current value. Changing the plot type is not recommended.
JPY
This line represents the Japanese Yen currency on the CSI.
- You can hide or display the JPY currency line using the checkbox.
- You can customize the color, opacity, and thickness of this plot by clicking the color box. The default color is magenta, and the thickness is set to 3. Please do not change the color setting here if you also like to change the color of the currency label.
- The second box allows you to change the plot type and enable the Price Line. The Price Line is a horizontal line that keeps track of the plot’s current value. Changing the plot type is not recommended.
CAD
This line represents the Canadian Dollar currency on the CSI.
- You can hide or display the CAD currency line using the checkbox.
- You can customize the color, opacity, and thickness of this plot by clicking the color box. The default color is purple, and the thickness is set to 3. Please do not change the color setting here if you also like to change the color of the currency label.
- The second box allows you to change the plot type and enable the Price Line. The Price Line is a horizontal line that keeps track of the plot’s current value. Changing the plot type is not recommended.
AUD
This line represents the Australian Dollar currency on the CSI.
- You can hide or display the AUD currency line using the checkbox.
- You can customize the color, opacity, and thickness of this plot by clicking the color box. The default color is blue, and the thickness is set to 3. Please do not change the color setting here if you also like to change the color of the currency label.
- The second box allows you to change the plot type and enable the Price Line. The Price Line is a horizontal line that keeps track of the plot’s current value. Changing the plot type is not recommended.
NZD
This line represents the New Zealand Dollar currency on the CSI.
- You can hide or display the NZD currency line using the checkbox.
- You can customize the color, opacity, and thickness of this plot by clicking the color box. The default color is gray, and the thickness is set to 3. Please do not change the color setting here if you also like to change the color of the currency label.
- The second box allows you to change the plot type and enable the Price Line. The Price Line is a horizontal line that keeps track of the plot’s current value. Changing the plot type is not recommended.
Overbought
This is a horizontal line which serves as a guide in indicating a currency has reached a state of overbought when its line crosses above this threshold.
- You can hide or display the Overbought line using the checkbox.
- You can customize the color, opacity, and thickness of this plot by clicking the color box. The default color is gray, and the thickness is set to 3.
- The second box allows you to choose a different line style.
- The text box defines the price level of the horizontal line. We recommend keeping its value at 80.
Oversold
This is a horizontal line which serves as a guide in indicating a currency has reached a state of oversold when its line crosses below this threshold.
- You can hide or display the Oversold line using the checkbox.
- You can customize the color, opacity, and thickness of this plot by clicking the color box. The default color is gray, and the thickness is set to 3.
- The second box allows you to choose a different line style.
- The text box defines the price level of the horizontal line. We recommend keeping its value at 20.
Labels
This option shows/hides the label objects used by the indicator. Please keep this option enabled.
Precision
This determines the number of decimal places the indicator uses to display the current value of its plots. You can adjust this by choosing from a drop-down list.
Alerts
The Currency Strength Indicator (CSI) has a total of 32 alert conditions.
Overbought
Alert Conditions
- USD overbought
- EUR overbought
- GBP overbought
- CHF overbought
- JPY overbought
- CAD overbought
- AUD overbought
- NZD overbought
Condition
Triggers when the line (USD, EUR, GBP, CHF, JPY, CAD, AUD, NZD) is greater than or equal to 80 (overbought).
Alert message
Examples:
- USD overbought at {value of USD}
- EUR overbought at {value of EUR}
- GBP overbought at {value of GBP} … and so on
Oversold
Alert Conditions
- USD oversold
- EUR oversold
- GBP oversold
- CHF oversold
- JPY oversold
- CAD oversold
- AUD oversold
- NZD oversold
Condition
Triggers when the line (USD, EUR, GBP, CHF, JPY, CAD, AUD, NZD) is less than or equal to 20 (oversold).
Alert message
Examples:
- USD oversold at {value of USD}
- EUR oversold at {value of EUR}
- GBP oversold at {value of GBP} … and so on
Overbought or Oversold
Alert Conditions
- USD OB/OS
- EUR OB/OS
- GBP OB/OS
- CHF OB/OS
- JPY OB/OS
- CAD OB/OS
- AUD OB/OS
- NZD OB/OS
Condition
Triggers when the line (USD, EUR, GBP, CHF, JPY, CAD, AUD, NZD) is greater than or equal to 80 (overbought).
Triggers when the line (USD, EUR, GBP, CHF, JPY, CAD, AUD, NZD) is less than or equal to 20 (oversold).
Alert message
Examples:
- USD OB/OS at {value of USD}
- EUR OB/OS at {value of EUR}
- GBP OB/OS at {value of GBP} … and so on
Currency Cross
Alert Conditions
- USD cross
- EUR cross
- GBP cross
- CHF cross
- JPY cross
- CAD cross
- AUD cross
- NZD cross
Condition
Triggers when the line crosses with any of the 7 other currencies.
Alert message
Examples:
- USD cross detected at {value of USD}
- EUR cross detected at {value of EUR}
- GBP cross detected at {value of GBP} … and so on